
The Federal Reserve Industrial Production & Capacity Utilization report shows a 0.6% increase in industrial production. Manufacturing alone grew by 0.8% for the month after plunging -0.9% in January due to horrific weather. This is the largest factory output gain since last August, Utilities were slightly down by -0.2% after January's polar vortex winter increase of 3.8%. Mining increased 0.3%. The G.17 industrial production statistical release is also known as output for factories and mines. The graph below shows industrial production index.
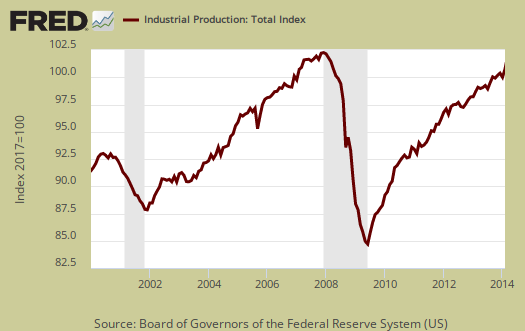
Total industrial production has increased 2.8% from a year ago. Currently industrial production is 1.6 percentage points above the 2007 average. Below is graph of overall industrial production's percent change from a year ago.
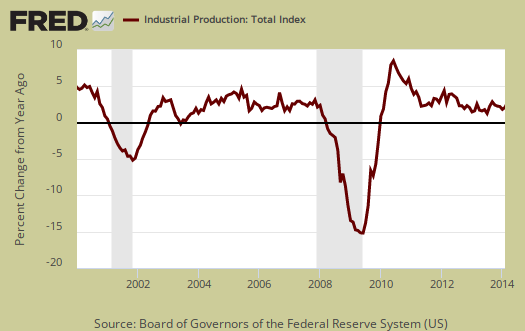
Here are the major industry groups industrial production percentage changes from a year ago. The below shows manufacturing is really fairly weak, even with this month's strong showing.
- Manufacturing: +1.5%
- Mining: +6.1%
- Utilities: +8.3%
Manufacturing output is still 2.8 percentage points below it's the 2007 average.. Below is a graph of just the manufacturing portion of industrial production.
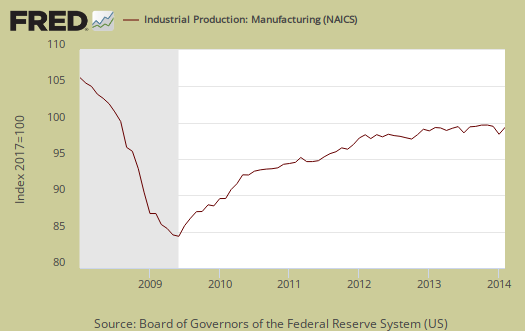
Within manufacturing, durable goods increased 0.9% for the month and has increased by 2.7% from a year ago. Autos & Parts was on fire, with a 4.8% monthly gain. Machinery and fabricated metal products both increased by 1.5%.

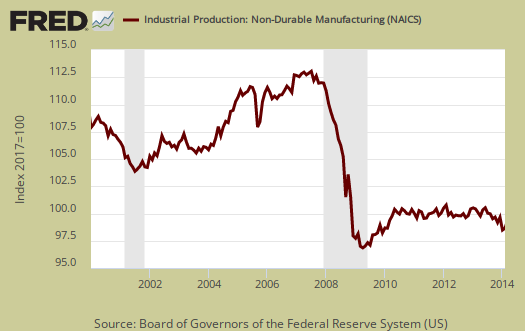
Nondurable goods manufacturing increased by 0.7% for the month, yet in January plunged by -1.1%. Nondurables have increased just 0.5% from a year ago..
Mining showed a 0.3% monthly increase and for the year has increased 6.1%. Mining includes oil and gas production, which has grown considerably, as shown in the below graph.

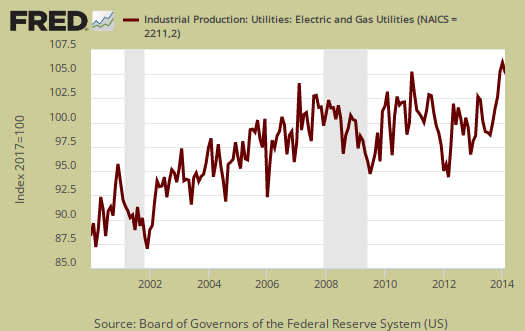
Utilities are volatile due to weather and why the below graph shows the wild January and also why utilities remained high in effect for February. Brrrr.
There are two reporting methodologies in the industrial production statistical release, market groups and industry groups. Market groups is output bundled together by market categories, such as business equipment or consumer goods. Industrial output is by NAICS codes and is for all manufacturing, or all types of durable goods manufacturing*. Below is the Fed's description of Market groups from the report and their monthly percent changes. Looks like automotive is the bright spot in the otherwise ho hum industrial production figures.
In February, the production of consumer goods rose 0.8 percent and was 2.6 percent above its level of a year earlier. The indexes for consumer durables and consumer non-energy nondurables moved up 2.1 percent and 0.9 percent, respectively, in February, while the index for consumer energy products decreased 0.8 percent. Within consumer durables, the production of automotive products jumped 4.6 percent to reverse most of a similarly sized decrease in January, and the output of home electronics increased 0.7 percent. These gains in February were partly offset by a decrease of 1.7 percent in the production of appliances, furniture, and carpeting as well as a decline of 0.1 percent in the output of miscellaneous goods. Within consumer non-energy nondurables, the indexes for foods and tobacco, for chemical products, and for paper products each rose about 1 percent, while the output of clothing moved down 0.7 percent.
The production of business equipment rose 1.3 percent in February after having been little changed, on net, over the preceding four months. The indexes for transit equipment and for industrial and other equipment, which had been the principal contributors to the slower pace of business equipment growth in those months, increased 2.0 percent and 1.6 percent in February, respectively. Unlike the other major components of business equipment, information processing equipment posted a small decrease in February after having advanced somewhat from September to January. The output of business equipment in February was 2.8 percent above its year-earlier level.
The production of defense and space equipment increased 0.2 percent in February following a decline of 0.3 percent in January. The index for this market group was 2.6 percent above its level of 12 months earlier.
Among nonindustrial supplies, the output of construction supplies moved up 0.2 percent in February after having fallen in each of the previous two months. The index for construction supplies was 0.1 percent above its level of a year earlier; between February 2012 and February 2013, the index had increased 4.5 percent. The production of business supplies rose 0.7 percent in February, more than reversing its decline in January, and was 3.1 percent higher than its year-earlier level.
The production of materials to be processed further in the industrial sector rose 0.4 percent in February and stood 3.2 percent above its level of a year earlier. In February, gains were widespread among the components of materials. The output of durable materials moved up 0.4 percent; the production of consumer parts recorded a large increase, while the index for equipment parts also rose. The production of nondurable materials advanced 1.0 percent in February, retracing about half of its loss in January. Sizable increases in the indexes for paper materials and chemical materials in February more than offset a large decline in the index for textile materials. The output of energy materials edged up 0.1 percent and was 6.2 percent above its level of a year earlier.
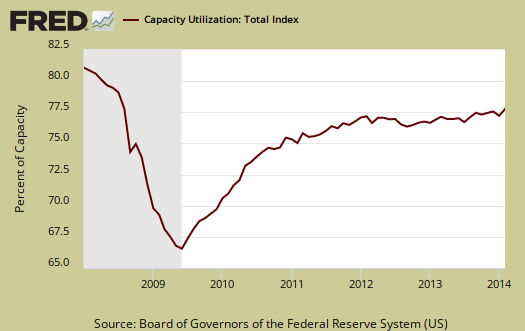
Capacity utilization, or of raw capacity, how much is being used, for total industry is 78.8%, a 0.3 percentage point monthly increase. How much plants are utilized is now 1.3 percentage points below the average from 1972 to 2013. Capacity utilization has increased 0.7 percentage points from a year ago. Manufacturing capacity utilization is now 76.4% and is 0.1 percentage points lower than a year ago. Mining capacity utilization is 89.1% and is up 1.1 percentage points from a year ago. Utilities use of it's capacity is 83.3% and this is an increase of a whopping 5.8 percentage points from a year ago.
Capacity utilization is how much can we make vs. how much are we currently using, of what capacity is available now, or output rate. Capacity utilization is also called the operating rate. Capacity utilization is industrial production divided by raw capacity.
Capacity growth is raw capacity and not to be confused what what is being utilized. Instead, this is the actual growth or potential to produce. Capacity is the overall level of plants, production facilities, and ability to make stuff, that we currently have in the United States. Capacity growth overall has increased 1.9 percentage points from a year ago, the same as the previous two months Below is the capacity growth increase from a year ago of the subcategories which make up industrial production.
- Manufacturing: +1.6%
- Mining: +4.7%
- Utilities: +0.8%
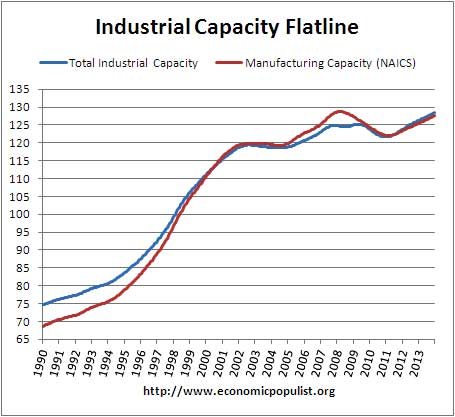
Now we need to make clear how raw industrial capacity has simply flatlined since 2000. This is the facilities, the plants, the industrial capabilities of the United States. Below is a graph of total industrial capacity up to 2013 and this includes manufacturing, logging, mining, utilities and publishing industries. Traditional manufacturing, as defined by NAICS codes is graphed in red. What we see is strong growth until about the year 2000, then raw capacity flatlines. The capacity utilization 85% high was in 1994/1995. Welcome to hollowed out America.
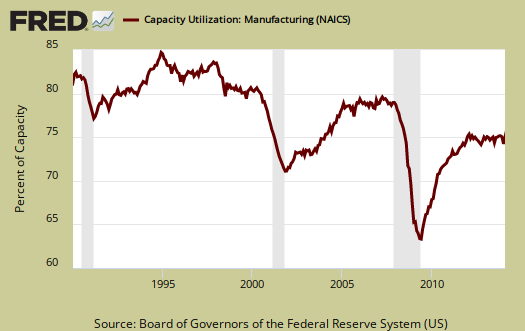
According to the detailed capacity table, in 1994/1995 semiconductors used 92.1% of their capacity. In February that figure was 66.4%. This is yet another statistic where offshore outsourcing shows up. With such large declines it is no wonder the U.S. economy is stunted Below is the Manufacturing capacity utilization graph, normalized to 2007 raw capacity levels, going back to the 1990's.
Here are our previous overviews, only graphs revised. The Federal Reserve releases detailed tables for more data, metrics not mentioned in this overview. If you are baffled by what crude, finished mean from the G.17 report, read these stages of production definitions. Stages of production have implications for exports and imports. Finishing industrial production implies goods for final sale and thus what kind of output one will see for the month. From the report:
Capacity utilization rates in February at industries grouped by stage of process were as follows: At the crude stage, utilization increased 0.1 percentage point to 86.9 percent, a rate 0.6 percentage point above its long-run average; at the primary and semifinished stages, utilization moved up 0.1 percentage point to 77.8 percent, a rate 3.1 percentage points below its long-run average; and at the finished stage, utilization rose 0.8 percentage point to 76.2 percent, a rate 0.9 percentage point below its long-run average.
*From the Federal Reserve definition details:
Market groups consist of products and materials. Total products are the aggregate of final products, such as consumer goods and equipment, and nonindustrial supplies (which are inputs to nonindustrial sectors). Materials are inputs in the manufacture of products. Major industry groups include three-digit NAICS industries and aggregates of these industries-for example, durable and nondurable manufacturing, mining, and utilities.
Recent comments