
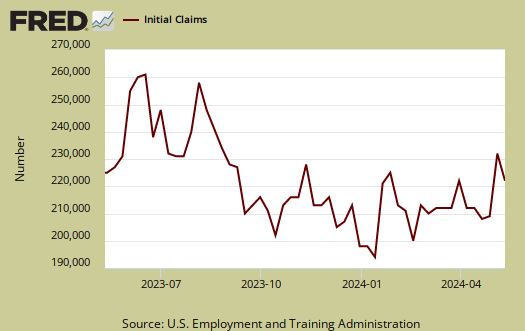
Initial weekly unemployment claims dropped to 407,000 this week. That's close to the magic number, 400,000 or below, needed to start creating jobs. This is the lowest number since July 2008, over two years. Initial weekly unemployment claims is a volatile number, subject to revisions.
From the jobless claims report:
In the week ending Nov. 20, the advance figure for seasonally adjusted initial claims was 407,000, a decrease of 34,000 from the previous week's revised figure of 441,000. The 4-week moving average was 436,000, a decrease of 7,500 from the previous week's revised average of 443,500.
That said, this is the release from the previous week:
In the week ending Nov. 13, the advance figure for seasonally adjusted initial claims was 439,000, an increase of 2,000 from the previous week's revised figure of 437,000. The 4-week moving average was 443,000, a decrease of 4,000 from the previous week's revised average of 447,000.
As one can see, last week's numbers were revised +2,000, comparing the previous week numbers to this advance, one gets a headline buzz of an 34,000 drop. Yet comparing advance reports, without revisions, the drop is 32,000.
This is still pretty damn impressive, but one report doesn't a trend make.
What is the reason for the sudden drop? A shorter work week, weather, seasonal temporary hiring? Initial unemployment claims is seasonally adjusted, but even then, if one has a shift, there could be an outlier data point.
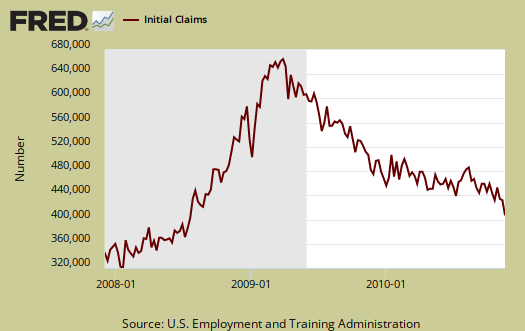
Below is the mathematical log of initial weekly unemployment claims, so one can get a better sense of the rise and fall of the numbers. A log helps remove some statistical noise, it's kind of an averaging. As we can see we have a step rise during the height of the recession, but then a leveling, not a similar decline until now. We have this yo-yo bobblehead, over 400,000, never ending labor malaise. Let's hope this trend continues. This report is very promising, but looking at the average and trends is more prudent.
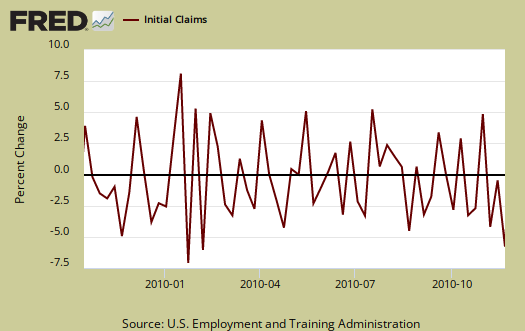
Below is a graph of the percent change in initial weekly unemployment claims for the last year. Look at how the numbers change bobs around zero, up and down, like a yo-yo.
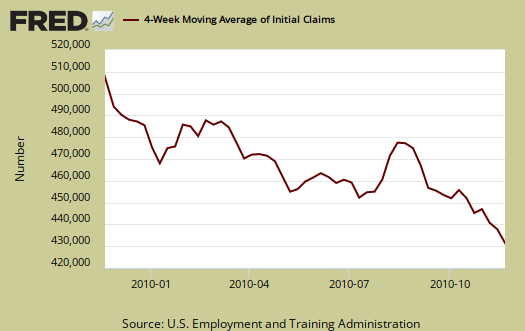
Below is the 4 week moving average, set to a logarithmic scale to remove even more statistical noise, for the last year. Here a trend that is certain would appear. It looks like we have a start, but keep your fingers crossed, wait and see if the above report is an anomaly. After all, with these kinds of numbers going on for years now, surely everyone in America has already been fired.
Here is the drop in those covered by unemployment insurance, 160,191 who dropped off the rolls (in all probability) from extended unemployment benefits.
States reported 3,801,294 persons claiming EUC (Emergency Unemployment Compensation) benefits for the week ending Nov. 6, a decrease of 160,191 from the prior week. There were 3,583,412 claimants in the comparable week in 2009. EUC weekly claims include first, second, third, and fourth tier activity.
There are two ways to drop from unemployment insurance, get a job, or more likely, run out of time and fall off of the benefit and count. Which one do you believe happened here?
Recent comments