
The July 2015 ISM Non-manufacturing report shows a services sector growth blowout. The overall index increased by +4.3 percentage points, to 50.3%, a record high. The NMI is also referred to as the services index. New orders increased by 3.4 percentage points. Employment also had a blowout with a 6.9 percentage point increase. The report hits decade highs in many subcategories and the employment index closely models the BLS employment figures.

The comments from survey respondents quotes were all positive and implied growth. Only the Avian flu was mentioned as still impacting the egg supply.
Generally speaking a value above 50 for NMI indicates growth, below 50 indicates contraction. The below table shows the ISM non-manufacturing indexes.
| ISM NON-MANUFACTURING SURVEY - July 2015 | ||||||
|---|---|---|---|---|---|---|
| Index |
Series Index July |
Series Index June |
Percent Point Change |
Direction |
Rate of Change |
Trend (Months) |
| NMI™ | 60.3 | 56.0 | +4.3 | Growing | Faster | 66 |
| Business Activity/Production | 64.9 | 61.5 | +3.4 | Growing | Faster | 72 |
| New Orders | 63.8 | 58.3 | +5.5 | Growing | Faster | 72 |
| Employment | 59.6 | 52.7 | +6.9 | Growing | Faster | 17 |
| Supplier Deliveries | 53.0 | 51.5 | +1.5 | Slowing | Faster | 2 |
| Inventories | 57.0 | 55.0 | +2.0 | Growing | Faster | 4 |
| Prices | 53.7 | 53.0 | +0.7 | Increasing | Faster | 5 |
| Backlog of Orders | 54.0 | 50.5 | +3.5 | Growing | Faster | 2 |
| New Export Orders | 56.5 | 52.0 | +4.5 | Growing | Faster | 3 |
| Imports | 50.5 | 48.0 | +2.5 | Growing | From Contracting | 1 |
| Inventory Sentiment | 63.5 | 65.0 | -3.0 | Too High | Slower | 218 |
Below is the graph for the non-manufacturing ISM business activity index, or current conditions, what we're doin' now meter. Business activity is at the highest level since December 2004. Here is the ISM's ordered services sector business activity list:
The 14 industries reporting growth of business activity in July — listed in order — are: Educational Services; Arts, Entertainment & Recreation; Public Administration; Wholesale Trade; Finance & Insurance; Retail Trade; Health Care & Social Assistance; Utilities; Real Estate, Rental & Leasing; Accommodation & Food Services; Management of Companies & Support Services; Construction; Transportation & Warehousing; and Information. The two industries reporting a decrease in business activity in July are: Professional, Scientific & Technical Services; and Mining.

New orders also is showing the highest growth since August 2005. Survey respondents mentioned more work and new products were coming. Below is ISM's new order growth vs. contraction list:
The 13 industries reporting growth of new orders in July — listed in order — are: Educational Services; Arts, Entertainment & Recreation; Retail Trade; Public Administration; Finance & Insurance; Utilities; Real Estate, Rental & Leasing; Transportation & Warehousing; Wholesale Trade; Health Care & Social Assistance; Construction; Accommodation & Food Services; and Management of Companies & Support Services. The three industries reporting contraction of new orders in July are: Other Services; Professional, Scientific & Technical Services; and Mining./blockquote>
The employment index also has not been this high since August 2005. The below ISM services employment graph has been normalized to 50, the ISM inflection point for expansion versus contraction. Generally speaking this is fantastic news, although the services sector has many, many low paying part-time jobs.
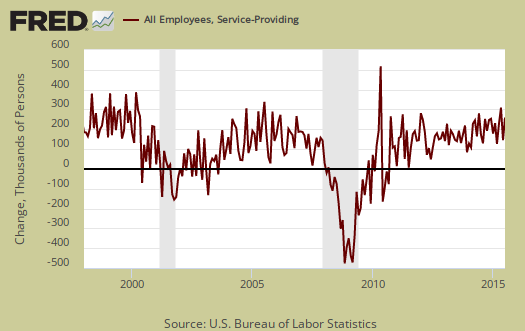
Below is all employees in services as reported by the BLS monthly level change graphed against the ISM services employment index. As we can see they match up reasonably well, although not exact on monthly figures. Yet this is yet another private indicator to use in guessing what the service sector July employment might be.
Inventories are the highest since Jun 2010. One commenter said there are new businesses that need new supplies.
New export orders also grew but note not records. New export orders are from outside the United States, but to be performed by domestically sourced workers. Notice how U.S. citizen/perm. resident labor is not part of this definition.
Prices paid by the services sector increased for the fifth straight month. This is not surprising when looking at oil and wholesale prices in other surveys.
Order backlogs also grew, abet for just the second month. A large portion of survey respondents, 40%, do not track on order backlogs.
Below are supplier deliveries or vendor supplies and it's how fast businesses are getting their stuff to make more stuff. Above 50 is a slow down, which is opposite how many of these sub-indices are defined. Slow-downs mean more demand yet too much can also limit the ability of that business to produce, or business activity. No stuff to make more stuff and you're stuck. This month the index showed supplier deliveries slowed further.
The use of imported materials grew after contracting in June. Services imports includes BPO, or offshore outsourcing can sometimes be classified as indirect materials. Other Services was at the top of the list for imports, which might very well mean there was a decline in use of offshore outsourcing, always good news to America.
Overall ISM gives an order list from expansion and contraction in the services sector.
The 15 non-manufacturing industries reporting growth in July — listed in order — are: Arts, Entertainment & Recreation; Educational Services; Retail Trade; Real Estate, Rental & Leasing; Public Administration; Transportation & Warehousing; Finance & Insurance; Wholesale Trade; Health Care & Social Assistance; Construction; Utilities; Accommodation & Food Services; Management of Companies & Support Services; Professional, Scientific & Technical Services; and Information. The two industries reporting contraction in July are: Mining; and Other Services.
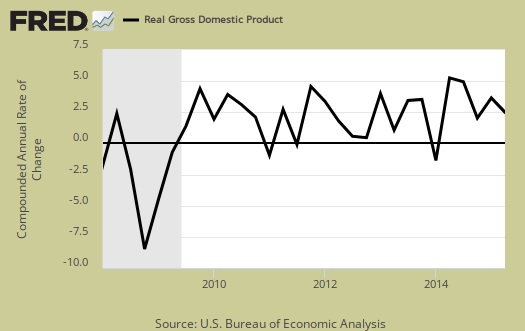
Some in the press are trying to extrapolate GDP from the services index. Beyond large changes, such as the declines in 2009, on a quarterly basis there isn't a lot of rhyme or reason between the NMI composite index, the business activity index and real GDP. We show this in the below graph with GDP on the left, in black, graphed against NMI, in red and the business activity index in green. We're sure if there was a strong correlation, ISM would publish it as well.
The NMI is made up of: Business Activity, New Orders, Employment and Supplier Deliveries, all equally weighted. Here is our past services index, overviews. You might also want to compare the services index to the ISM Manufacturing index.


Recent comments