
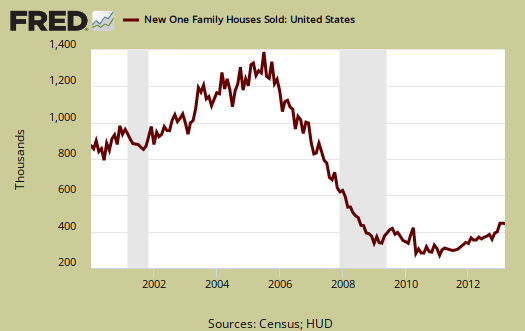
March New Residential Single Family Home Sales increased 1.5%, or 417,000 annualized sales. New Single Family Housing inventory is at a 4.4 month supply. New single family home sales are now 18.5% above March 2012 levels, but this figure has a ±17.2% margin of error. A year ago new home sales were 352,000. Sales figures are annualized and represent what the yearly volume would be if just that month's rate were applied to the entire year. These figures are seasonally adjusted as well. Beware of this report for most months the change in sales is inside the statistical margin of error and will be revised significantly in the upcoming months.
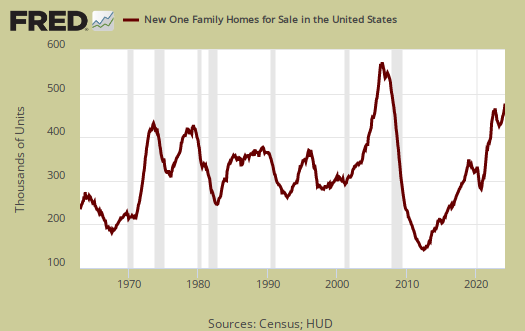
New homes available for sale increased 2.0% from last month. The average home sale price was $279,900, a -10.8% drop from last month's average price of $310,000. If one thinks about it, these prices are outside the range of what most wages can afford.
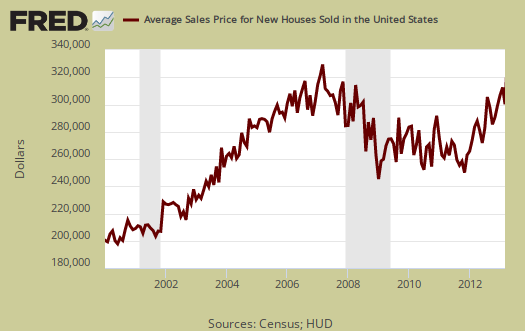
March's median new home price dropped -6.8% to $247,000. Median means half of new homes were sold below this price and both the average and median sales price for single family homes is not seasonally adjusted.

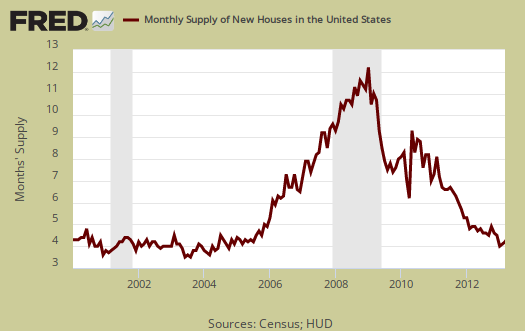
Inventories had no change from last month. The current supply of new homes on the market would now take 4.4 months to sell. From a year ago housing inventory has declined -10.2% and is still inside the margin of error of ±15.1%.
Below is a graph of the months it would take to sell the new homes on the market at each month's sales rate. We can see these inventories vs. sales times did plunge, but the statistics won't show if these rates have stabilized for at least three months.
The median time a house was completed and on the market for sale to the time it sold was 5.0 months, the same as February.

The variance in monthly housing sales statistics is so large, in part, due to the actual volume declining, along with the fact this is a survey. One needs to look at least a quarter to get a real feel for new home sales, but a year of sales data is more in order. Additionally this report, due to it's huge margin of error, is almost always revised significantly the next month. Buyer beware on month to month comparisons and reacting to primarily figures and why we graph up the statistics so one can identify a real trend versus press headline buzz.
What we know for certain about new homes sales are increasing from the year ago change. We also know inventories have plunged. Finally, we also see new single family home prices becoming out of reach for most families by income again. We list the margins of error for they are usually above the monthly reported percentage changes. The Census notes that the average revision is about 5% of the original reported.
Here is our overviews of residential real estate statistics, only some graphs revised.
calculated risk sees bright future
Bill McBride (Calculated Risk) thinks " housing is historically the best leading indicator for the economy, and this is one of the reasons I think The future's so bright, I gotta wear shades."
http://www.calculatedriskblog.com/2013/04/a-few-comments-on-new-home-sal...
Wonder how you respond?
I think CR is smoking crack
Links don't work on anonymous comments, you have to login. CR on new home sales.
750-800k sales annualized from ~420k is almost double. That puts sales levels around 2000 time frame. So it depends on what he means by "several years". Next couple of years well, they are running out of institutional investors and these are new homes vs. picking off cheap foreclosures and short sales. Wages just do not support it and anyone believing a flood of immigrants is going to buy up all of those new homes, think again. It's called wage repression if they flood the labor market and people, the average wage, just cannot afford these houses, even at this beyond belief low 30 year mortgage rates.
I can see 500k in 2014 though even with most Americans staying flat broke, busted as most are today. Unless they grow the middle class and every policy I see is opposite to do that, including this immigration agenda, I don't see how that many people will be able to afford a new home, even with the increase in overall population, I don't see how the U.S. returns to even 2000 new home sales levels.
Crack Smoking
Thank you for your response. After reading CR my 'gut response' was the same as yours: 'what is he smoking'. But, I'm not informed enough to challenge his conclusions so I appreciate your conformation.