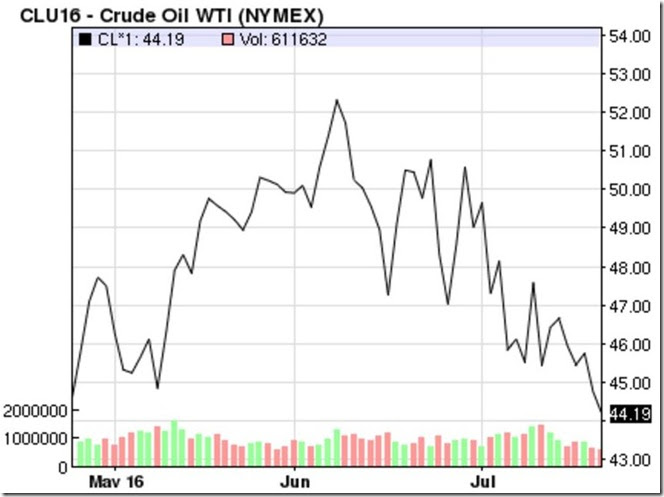
Oil prices continued to erode last week as traders and the media continued to focus on the increasing glut of refined products. After closing at $45.24 a barrel on Monday, down from last Friday's $45.95, oil fell again late Tuesday to close at $44.65 a barrel after the American Petroleum Institute's estimates showed an unexpected increase in gasoline supplies. Prices steadied on Wednesday when the EIA confirmed that gasoline inventory increase, but also showed the ninth consecutive weekly crude drawdown as trading for August oil expired. Prices then sank to close at $44.75 a barrel on Thursday in a delayed reaction to the EIA report, which also showed the combination of oil and product stockpiles at a new all-time high. Oil then traded below $44 a barrel on Friday as the media picked up on the gasoline glut story, and stayed depressed Friday afternoon to close at $44.19 a barrel, after the rig count report showed the largest percentage increase in oil drilling rigs since December 2009. Since it's probably easier to look at a picture of how oil prices have slumped than to read text, we'll include a graph of the daily price changes over the past three months below.
This graph now shows daily prices per barrel over the past 3 months for the September contract of the US benchmark oil, West Texas Intermediate (WTI). Since this graph only shows prices for September delivery, the earlier prices quoted for the expired August contract are not shown, but the trajectory has been the same. It appears that the springtime oil price rally, which saw oil prices nearly double from near $26 a barrel in late February to over $50 a barrel by early June, is now over, having succumbed to the British vote to exit the European Union, which broke the three month uptrend.
July Drilling Productivity Report
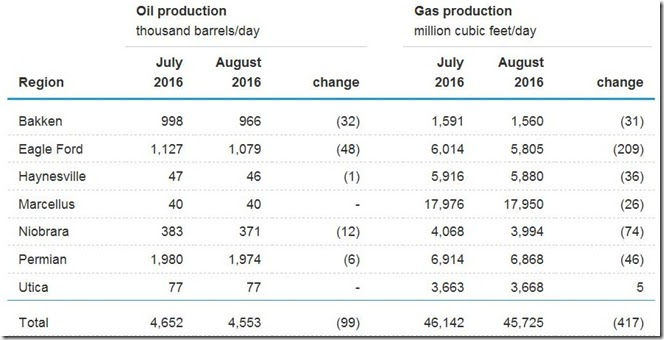
This week the EIA released the Drilling Productivity Report for July, which estimates the output of oil and gas per working rig from the seven major US shale basins, including the Utica shale, and projects output for the next month, based on their recent data from existing oil and natural gas wells. Note that this report does not distinguish between oil-directed rigs and gas-directed rigs, because more than half of the existing wells produce both oil and gas, regardless of the targeted formation. We'll start with the summary table of drilling production projections by region, which is from under Tab 2 on the web landing page for the report (note that the report itself is a series of pdfs linked to on the sidebar, under "contents")
The above table shows the expected output of oil and natural gas for July and August for the 7 major shale basins, which together account for 92% of US shale output. Oil in thousands of barrels per day is shown in the 3 columns on the left, while projections for natural gas in million cubic feet per day is shown in the three columns to the right. Note the change columns in each case is in units, not percent, and thus total oil production in most basins other than the Permian is expected to fall on the order of 4%, while the percentage drop in total US production of natural gas is primarily from the Eagle Ford and Niobrara (map from the report of all 7 regions is here)
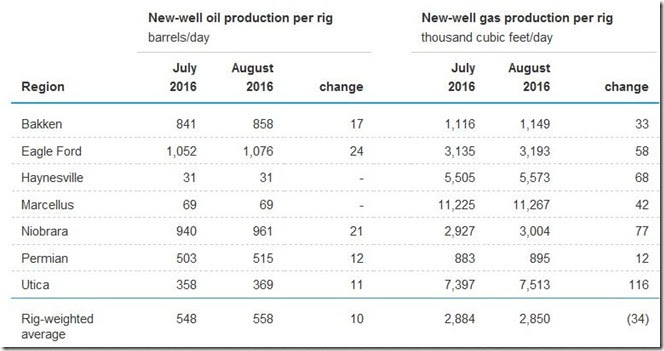
The next table, from under Tab 1 of the report, shows the drilling productivity for new wells on a per rig basis. The EIA estimates new-well production per rig using several months of recent data on total production from new wells for each field, divided by the region's monthly rig count. Here, in all regions, drilling productivity for new wells is still expected to increase monthly from July to August, as it has over the history of fracking extraction..
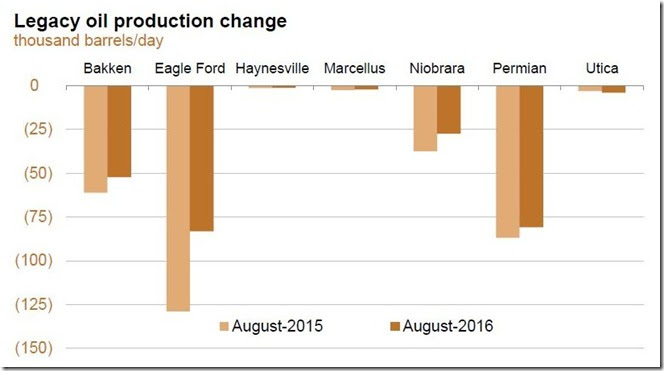
The next two graphs, from the Year-over-year summary (pdf), show the expected drop in August production from old wells, as compared to the decrease from old wells in August a year ago. In general, these graphs shows us the expected well depletion rate for the existing wells in each basin...
Above is the expected decrease in thousands of barrels of oil per day for the wells currently producing oil in each basin. Again, since this is in units of decrease, rather than percentage, it tells us the obvious, that those basins with the largest amount of current production will see the largest decreases. Those who would want to work out the percentage declines for each basin based on our first table can do so. What is noteworthy here is that for the most part, the decreases going forward will be less than in 2015, because of the larger percentage of old wells which deplete somewhat slower. The Utica, with a large percentage of relatively newer wells, is the only basin where the August 2016 oil depletion rate is expected to be greater than that of last year
Llike the oil graph, the natural gas bar graph above shows us the expected August decrease in million cubic feet per day for the wells currently producing gas in each basin, against the similar decrease in August 2015. Once again, for most basins, the decreases in natural gas output going forward will be less than they were in 2015, because of the larger percentage of old wells. The exceptions are again the Utica, with it's larger percentage of newer wells, and the Permian, which has been producing more natural gas recently than it had in the legacy years.
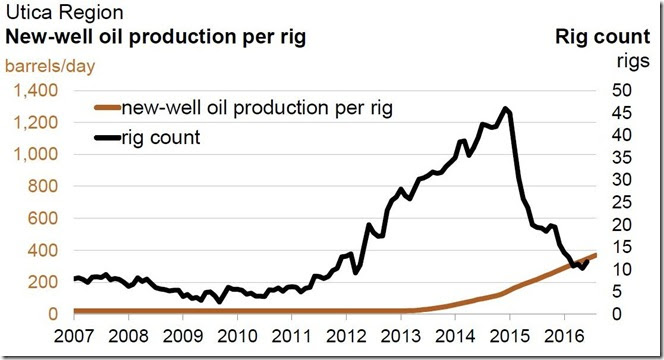
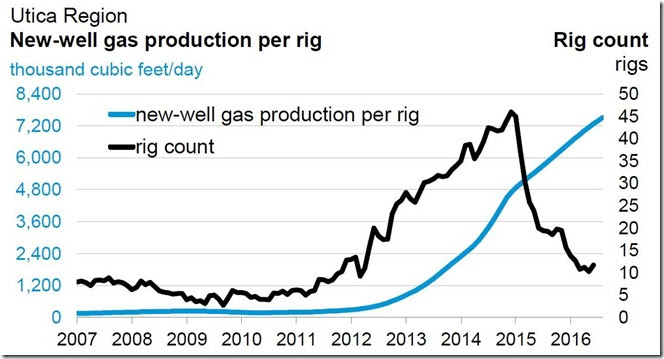
The next two graphs we'll include are for oil and natural gas productivity for new Utica wells. Once again, the EIA is estimating August output from new wells based on recent historical data on total production from new wells divided by the region's average monthly rig count, lagged by two months. In this first graph below, the total Utica rig count since 2007 is shown in black, while the output of oil per rig from new wells is shown as a brown graph over that same span...
In the second graph of this set below, the total Utica rig count is again shown in black, while the output of natural gas from new wells per rig in thousand cubic feet per day in shown in blue. Now, look closely as those productivity lines, brown above for oil and blue below for natural gas. We can see that oil output per new Utica well has quadrupled from under 100 barrels per day to nearly 400 barrels per day in the short span from mid 2014 to mid 2016. Similarly, natural gas output per new Utica well has tripled, from 2,500,000 cubic feet per day to 7,500,000 cubic feet per day over the same 2 year span (after it had quadrupled in the prior two years, so there's been a twelve-fold increase per new well in 4 years). Also notice that neither the brown line for oil nor the blue line for natural gas shows any sign of topping out, ie, if the trend continues, we might even expect another tripling two years hence.
So, why have we seen such a exponentially increasing rate of productivity? In part, it’s because the frackers are getting better at what they do; ie, their fracking techniques have improved. But another big factor is that with prices so depressed, they're no longer fracking half the state willy-nilly, like Chesapeake did during the McClendon era. They are only fracking in those locations where they believe that profitable production is pretty much a sure thing, and hence they're now producing as much gas and oil from new wells running a dozen rigs than McClendon & his boys did two years ago with 4 dozen rigs.
The Latest Oil Stats from the EIA
Wednesday's release of US oil data for the week ending July 15th by the US Energy Information Administration indicated that our oil imports rebounded back to above recent averages, that our refineries ramped back up to seasonal levels to use all of those extra imports, and as a result another small portion of our monstrous glut of crude oil was converted into a glut of refined products. Our caveat for this review is that this week's crude oil fudge factor included to make the weekly U.S. Petroleum Balance Sheet (line 13) balance out was +498,000 barrels per day, which meant that 498,000 more barrels per day showed up in our final consumption and inventory figures this week than were accounted for by our production and import figures, meaning one or several of this week's metrics were incorrect by that amount, errors which are typically due to inadequacies in gathering or reporting that data. That makes for the 4th week in a row when we've seen a large positive adjustment, and as a result this year's cumulative daily average of that weekly statistical adjustment has also turned positive by 18,000 barrels per day, after several months of being negative. During most of the preceding weeks this year, much of what we appeared to have produced or imported did not show up in the final consumption or inventory figures, and that statistical aberration has now completely reversed..
Our field production of crude oil inched up for the 2nd week in a row, as oil output from US wells rose by 9,000 barrels per day to an average of 8,494,000 barrels per day during the week ending July 15th. Again, like last week, the entirety of the increase resulted from a 38,000 barrel per day increase from Alaska, while production in the lower 48 was down 29,000 barrels per day. Even with the back to back increases, our oil output still remained 725,000 barrels per day below the pace we saw at the beginning of this year, and was still 11.1% lower than the 9,562,000 barrels we produced during the week ending July 17th of 2015, and 11.6% lower than the record 9,610,000 barrel per day oil production that we saw during the week ending June 5th last year.
At the same time, the EIA reported that our imports of crude oil rose by an average of 293,000 barrels per day to an average of 8,134,000 barrels per day during the week ending July 15th, nearly a million barrels per day, or nearly 13% more than the 7,199,000 barrels of oil per day we were importing during the week ending July 17th a year ago...Meanwhile, the 4 week average of our imports reported by the EIA's weekly Petroleum Status Report (62 pp pdf) actually slipped back to an 8.0 million barrel per day level, which was only 5.9% higher than during the same four-week period last year.
In the meantime, usage of that crude oil by U.S. refineries rose by 319,000 barrels per day from the prior week during the week ending July 15th, as the US refinery utilization rate rose to 93.2% during the week, up from 92.3% of capacity during the week ending July 8th. This week’s refinery throughput was virtually unchanged from the 16,870,000 barrels per day US refineries used during the week ending July 17th last year, however, when US refineries were operating at 95.5% of capacity..
Even with the increase in refining, however, our refineries’ production of gasoline fell back from the elevated levels of last week, dropping by 168,000 barrels per day to an average of 10,050,000 barrels per day during the week ending July 15th. That was 0.6% lower than the 10,109,000 barrels per day of gasoline produced in the same week last year, but about 2% higher than last July's average output. At the same time, refinery output of distillate fuels (diesel fuel and heat oil) also slipped, falling by 30,000 barrels per day to 5,004,000 barrels per day during the week ending July 15th. That also put distillates output 1.4% below the 5,073,000 barrels per day that was being refined the same week last year, which was on a par with distillates output for that month. It's a bit puzzling to see output of both gasoline and distillates down with such a large increase in refinery inputs, but i see no easy explanation; production of propane/propylene was up by 55,000 barrels per day to 1,734,000 barrels per day, and output of residual fuels was up by 24,000 barrels per day to 413,000 barrels per day, but production of jet fuel was also down, albeit by an insignificant 5,000 barrels per day to 1,722,000 barrels per day..
Even with the large drop in our output of gasoline, our gasoline inventories rose again, by 911,000 barrels to 241,000,000 barrels as of July 15th, the fourth increase in the past 5 weeks, at a time of year when our gasoline supplies are usually being used up; in fact, July 15th saw the highest summertime level for gasoline supplies in the EIA's weekly records. Contributing to the increase in gasoline inventories was a 57,000 barrel per day increase in our gasoline imports to 897,000 barrels per day, which was also 62,000 barrels per day more than the 815,000 barrels of gasoline we imported during the same week a year earlier. As a result, this week's gasoline inventories were 11.4% higher than the 216,285,000 barrels of gasoline that we had stored on July 17th last year, and also 10.6% higher than the 217,871,000 barrels of gasoline we had stored on July 18th of 2014. Thus our gasoline supplies remain categorized by the EIA as "well above the upper limit of the average range" for this time of year..
At the same time, our distillate fuel inventories fell by 216,000 barrels to 152,783,000 barrels on July 15th, using up a small portion of the 4,058,000 barrel distillates inventory increase we saw a week ago. Since our distillate inventories have continued to run far above the normal level after the warm winter reduced US heat oil consumption, our distillate inventories as of July 15th were still 8.0% higher than the 141,515,000 barrels of distillates we had stored as of July 17th last year, and 21.3% higher than our distillates supplies as of July 18th 2014, and thus they were again characterized as "well above the upper limit of the average range" for this time of year.
Finally, as our refineries more than kept pace with our increased imports, we again needed to withdraw 2,342,000 more barrels of oil from our stocks of crude in storage to meet the week's need, as thus our crude oil inventories fell to 519,462,000 barrels as of July 15th. But that's a fairly normal withdrawal rate for this time of year, and it left us with 12.0% more oil in storage than the 463,885,000 barrels we had as of the same weekend a year earlier, and 40.0% more oil than we had stored on July 18th of 2014. With our oil supplies thus continuing to beat the seasonal records we set most every week in 2015, it should go without saying that our crude oil supplies also remain "well above the upper limit of the average range" for this time of year..."
(Note: the above was excerpted from my weekly post at Focus on Fracking)


Comments
how long did last petroleum crash last?
It seems prices plummeted in the 90's and stayed that way for at least a decade but I'm not sure. Do you know?
BTW: I am modifying the site code and have been, why no writing. Almost at a stopping point. Email me if anyone sees weird bugs of course.
Is it cyclical
Forgot to see if there is a cycle pattern to oil boom and bust.
probably
boom prices probably encourage overinvestment in new production which ultimately leads to a supply glut and a bust...the bust in turn leads to a long period of little new investment in exploration and exploitation while the older fields deplete, eventually leading to a period where demand outstrips supply and another boom..
rjs
12 years
oil crashed to $7 a barrel in 1986, and except for a few geopolitcal spikes, stayed in a range below $25 a barrel till about 1998...
rjs