Oil prices remained volatile last week, as countervailing waves of avarice and anxiety about the coming Russian and OPEC led production cuts swept over the oil markets, but by the end of the week they were little changed from last week's close. What might have been the largest price move of the year for US oil was unleashed before the week even started, as oil prices jumped $3 a barrel to $54.50 a barrel at the opening of Asian trading at 11 PM on Sunday, as global oil traders reacted to the agreement by Russia and ten other non OPEC oil producers last Saturday to join the cartel in cutting their oil output. Prices in New York were as high as $54.51 a barrel after US markets opened, the highest price since July 6, 2015, but fell back from there over the rest of the day to close Monday up just $1.33 at $52.83 a barrel. Oil then traded 50 cents higher on Tuesday morning, but slipped back to close at $52.98 a barrel after the American Petroleum Institute reported large increases in crude and gasoline inventories. Prices then fell back to close at $51.04 a barrel on Wednesday, despite the EIA report that US crude supplies had actually fallen, as the IEA (International Energy Agency) reported that OPEC had pumped 34.2 million barrels a day in November, a record high that was 300,000 barrels a day higher than their October record. Oil prices continued to fall on Thursday as the US dollar hit a 14-year high against other major currencies, briefly slipping below $50 a barrel, before climbing back near the close to settle down just 14 cents at $50.90 a barrel. Prices then rose again on Friday as oil traders regained faith in the OPEC deal and Goldman Sachs raised its oil price forecast to $57.50, as oil closed the week at $51.90 a barrel, for a gain of less than 1% from last Friday's close of $51.50..
We finally have some details on the secondary agreement to cut oil production that came out of that meeting of Russia and other non-OPEC oil producers last Saturday, which we didn't have much information on when we wrote about it at that time. That agreement is projected to reduce production of the 11 signatories by 558,000 barrels a day, on top of the 1.2 million barrels a day in cuts already agreed to by OPEC, thus amounting to a total reduction of about 1.8% of global oil supply. In addition to the 300,000 barrel per day cut expected from Russia, other producers contributing relatively large cuts include Mexico, who will cut 100,000 barrels a day, Kazakhstan, who will cut 50,000 barrels a day, Oman, who will cut 45,000 barrels a day, and Azerbaijan, who will cut 35,000 barrels a day...other participants, all with smaller output cuts, include Bahrain, Brunei, Equatorial Guinea, Malaysia, Sudan and South Sudan. Mexico's participation, especially to that degree, is the one surprising here, at least to me, because i'd thought i'd read that Mexico had opted out. But it does make sense for Mexico to curtail their output, because their aging giant Cantarell field has been in decline for years, and pushing it to maintain maximum output only risks its viability in the long run. Other than Russia, the country to watch among these non-OPEC producers will be Kazakhstan, who just brought their giant Kashagan oil field online in October. Operated by an international consortium including Exxon, Shell, Eni, Total, CNPC, and Japan’s Inpex, Kashagan was projected to add 80,000 barrels a day to Kazakhstan's output, and after spending $50 billion over a dozen years to get it operating, those big oil companies aren't going to want to see it slowed down..
Global Oil Supply and Demand
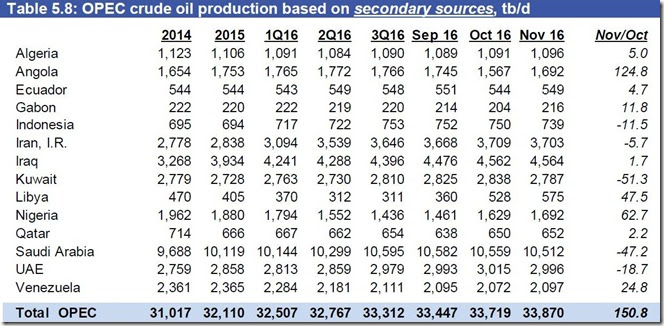
In addition to this week's release of the aforementioned report on global oil production from the Paris-based International Energy Agency, which is available to subscribers only, OPEC released their Monthly Oil Market Report for December, a free 101 page pdf, which we'll pull a few graphics out of to put this all in perspective. This first table is from page 60 of the OPEC pdf and it shows oil production in thousands of barrels per day for each of the OPEC members over the recent years, quarters and months as labeled. OPEC uses "secondary sources", such as analyst's reports from satellites and shipping data, as an impartial adjudicator for their for their quotas and production cuts, rather than use what's directly reported by the members (shown in Table 5.9, also on page 60), to resolve potential disputes that might arise if each member reported their own figures. What we're interested in here are the October and November 2016 figures, and the change between them, shown in the last column.. While they also show a new record for their November production, note that the increase reported here is only half of the 300,000 barrels per day jump to 34.2 million barrels a day that was reported by the IEA...
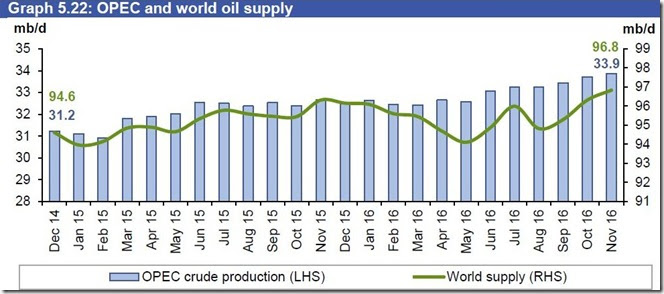
The next graphic, from page 61 of the December OPEC Monthly Oil Market Report, shows both OPEC and world oil production monthly on the same graph, from December 2014 to November 2016. The pale blue bars represent OPEC oil production in millions of barrels per day as shown on the left scale, while the green graph represents global oil production in millions of barrels per day, as shown on the right scale. According to OPEC, global oil production reached a new record of 96.84 million barrels per day in November, up by more than half million barrels per day from the 96.32 million barrels per day produced in October, and OPEC accounted for 35.0% of that global total..
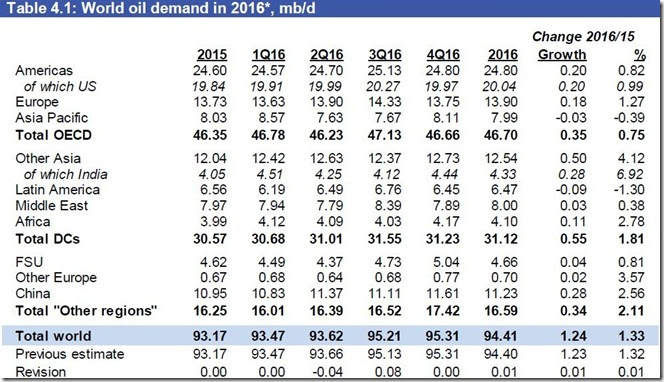
Next, from page 39 of the same OPEC report, we have global oil demand figures for 2015 and each of the quarters of 2016. This represents how much of that oil being produced that's shown above is being consumed, and basically by whom (FSU is the former Soviet Union countries). Thus, global consumption of oil throughout 2016 averaged 94.41 million barrels per day, and the projected demand for oil in the 4th quarter of this year works out to 95.31 million barrels per day, in contrast to November global production of 96.84 million barrels per day...
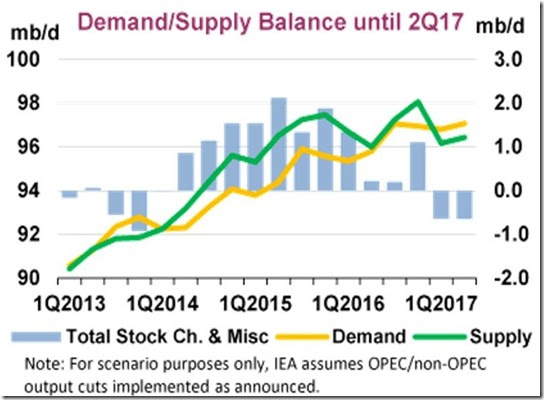
Finally, we have a graphic from the Public Page of the current IEA Oil Market Report, which shows what they project will happen to global oil supply and demand in the first two quarters of 2017 if OPEC and other oil producers go through with their oil production cuts as announced. The green graph shows oil production globally in millions of barrels per day for each quarter since the beginning of 2013, while the yellow graph shows global oil consumption in millions of barrels per day over that same span. The blue bars in the background of that graph show the difference, also in millions of barrels per day, between the green and yellow graphs, with a blue bar pointing upward representing the amount of oil surplus in a given quarter, while a blue bar pointing downward represents a deficit of oil, necessitating withdrawal of oil from storage, and typically resulting in higher oil prices until such time as some of the demand is squeezed out.. Thus we can see that the world has been producing surplus oil in various quantities since the 2nd quarter of 2014, from which time oil prices have fallen from above $100 a barrel to as low as $26. The IEA now projects that if OPEC and non-OPEC oil producers implement the oil production cuts they've indicated, there will be an estimated oil deficit of 0.6 million of barrels per day globally during the first two quarters of 2017.
Note: the above was excerpted from my weekly synopsis at Focus on Fracking


Comments
talk about an economic stranglehold
This will do 'er, except for ND of course. Thanks for the analysis, even though it's not good news.