
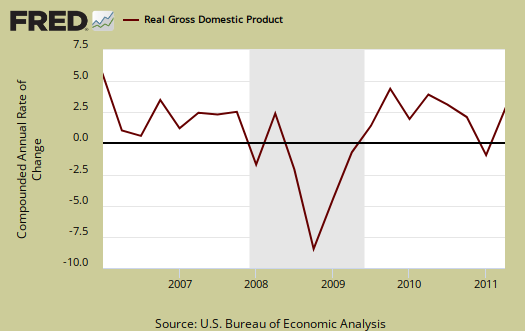
Q2 GDP 2011 3rd revision is in at 1.3%. This is a +0.3% revision from the Q2 2nd revision report, which reported a 1.0% Q2 GDP. Here is the original BEA GDP report. Q1 2011 GDP was 0.4%. The BEA reports real GDP by one decimal place of accuracy. Not rounded, real Q2 GDP was 1.34%.
The Q2 GDP 3rd revision had a upward revision in personal consumption, an upward revision in exports, a downward revision in imports Investment was the largest contribution by percent points and changes in private inventories was revised further downward.
As a reminder, GDP is made up of:
where
Y=GDP, C=Consumption, I=Investment, G=Government Spending, (X-M)=Net Exports, X=Exports, M=Imports*.
Here is the Q2 2011 3rd revision breakdown of GDP by percentage point contributions:
- C = +0.49
- I = +0.79
- G = –0.18
- X = +0.48
- M = –0.24
Here is the Q2 2011 second revision report breakdown of GDP by percentage point contributions:
- C = +0.30
- I = +0.78
- G = –0.18
- X = +0.41
- M = –0.33
Below are the percentage point differences, or spread between the Q2 3rd revision and Q2 2nd revision 2011 GDP report components. As we can see personal consumption was significantly revised upward, imports downward, exports up. You may be wondering how imports could decrease when we know the U.S. has a record trade deficits. This is because these numbers are chained, real dollars and also there are price multipliers to adjust for the actual price fluctuations of imports and exports.
- C = +0.19
- I = +0.01
- G = 0.00
- X = +0.07
- M = +0.09
Here is the Q1 2011 report breakdown of GDP by percentage point contributions:
- C = +1.47
- I = +0.47
- G = –1.23
- X = +1.01
- M = –1.35
Below is the spread between Q1 and Q2 by percentage point contributions to GDP. As we can see the contribution change was a dramatic drop on personal consumption counter-balanced by a large drop in imports. Spread in the change to GDP point contributions are not the same as percentage changes. Percentage changes are listed further down in this article.
- C = -0.98
- I = +0.32
- G = +1.05
- X = -0.53
- M = +1.11
Below the the St. Louis FRED graph for C, or real personal consumption expenditures of the above GDP equation. As we can see from the above, while PCE, or C was revised upward, it is still quite repressed.

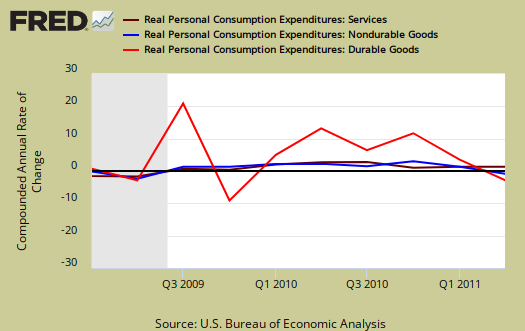
Below is the breakdown in C or real PCE annualized change. Notice when times are tough, durable goods (bright red) consumption drops. Notice the drop in durable goods this quarter. Durable goods has a –0.38 percentage point contribution in Q2, or a –5.3% decrease, in comparison to a 1.10 point contribution last quarter.
Changes in private inventories subtracted –0.28 percentage points to Q2 2011 1.34% GDP. Last quarter changes in private inventories contributed a +0.32 percentage point change. Seems the great inventory build up, recovering from the slash and burn of 2009 is over.

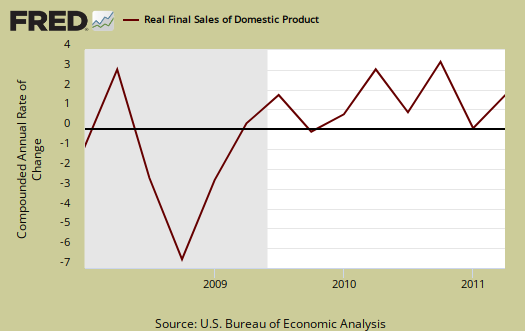
Below are real final sales of domestic product, or GDP - inventories change. This gives a better feel for real demand in the economy. This is slightly better news. Real demand increased 1.6%, versus a flat line or 0.0% for Q1. This is percentage change, not point contribution, so one might interpret real demand as barely breathing.
Below are net exports, or trade deficit, in real chained dollars, for Q2 2011.
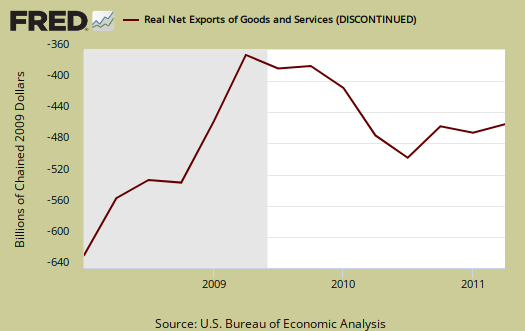
The below graph shows real imports vs. exports. While exports increased 3.6% from last quarter, we have a deceleration of trade generally for Q1 exports increased 7.9%. Q2 imports increased 1.4% versus a 8.3% change for Q1. Bottom line, it is the trade deficit that matters for GDP, although volume of trade implies a slower global economy as well. Q2 trade deceleration in imports, as noted above, helped overall Q2 GDP.

Below are the percentage changes of Q2 2011 GDP components in comparison to Q1. Realize there is a difference between percentage change and percentage point change. Point change adds up to the total GDP percentage change and is reported above. The below is the individual quarterly percentage change, against themselves, of each component.
- C = +0.7%
- I = +6.4%
- G = –0.9%
- X = +3.6%
- M = +1.4%
The BEA's comparisons in percentage change breakdown of 2nd quarter GDP components are below. Changes to private inventories is a component of I.
C: Real personal consumption expenditures increased increased 0.7% in Q2, compared with an increase of 2.1% in Q1. Durable goods decreased –5.3%, compared with an increase of 11.7%. Nondurable goods increased 0.2%, compared with an increase of 1.6%. Services increased 1.9%, in comparison to 0.8% from Q1.
I: Real nonresidential fixed investment increased increased 10.3% in the Q2, compared with an increase of 2.1% in Q1. Nonresidential structures increased 22.6%, in contrast to a decrease of -14.3%. Equipment and software increased 6.2%, compared with an increase of 8.7%. Real residential fixed investment increased 4.2%, in contrast to a decrease of -2.4%.
X & M: Real exports of goods and services increased 3.6% in Q2, compared with an increase of 7.9% in Q1. Real imports of goods and services increased 1.4%, in contrast to a increase of 8.3% in Q1.
G: Real federal government consumption expenditures and gross investment increased 1.9% in the Q2, in contrast to a decrease of -9.4% in Q1. National defense increased 7.0%, in contrast to a decrease of -12.6%. Nondefense decreased -7.6%, compared with a Q1 decrease of -2.7%. Real state and local government consumption expenditures and gross investment decreased -2.8%, Q1 dropped by -3.4%.
Motor Vehicles subtracted -0.10 percentage points to Q2 real GDP while computer final sales added +0.07 percentage point changes. This is different from personal consumption, or C auto & parts. Motor vehicles are bought as investment, as fleets by the government and so forth and in Q2, they bought less.
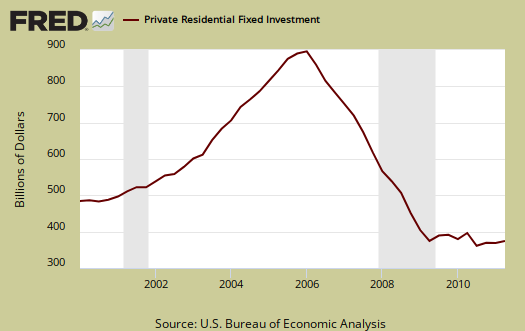
Residential fixed investment added +0.09 percentage points to Q2 GDP after subtracting a paltry -0.06 percentage points in Q1. Below is the raw totals on residential investment. If one could ever see the housing bubble and then it's collapse in terms of economic contributions, the below graph is it. Residential fixed investment changed +4.2% from Q1 2011.
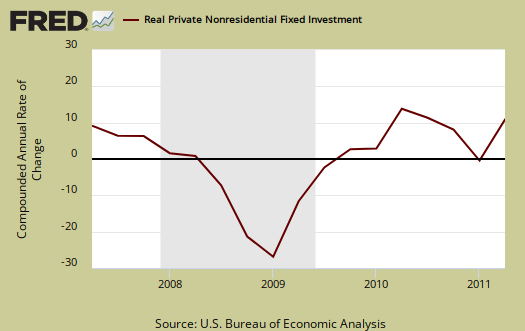
Private, or not from the government nonresidential investment improved, with a 10.3% change from last quarter and a 0.98 percentage point contribution to Q2 GDP. Structures was a 0.54 percent point contribution, or a 22.6% percentage change from Q1 to Q2. Keep those technology changes and updates coming, for equipment and software were a 0.44 percentage point Q2 GDP contribution and a 6.2% increase from Q1.
To have enough economic growth to generate enough jobs to keep up with population, as a multiplier, GDP needs to be at least 2.5%, annualized, per quarter.
* In Table 2, the BEA reports GDP contribution components with their equation sign. If durable goods for example, decreased over the quarter or year, it is reported as a negative number. Imports, from the GDP equation, are already a negative for that is not something produced domestically. A negative sign implies imports increased for the time period and a + sign means the change in imports decreased. Or, from the GDP equation: . Confusing but bottom line exports add to economic growth, imports subtract.
Recent comments