
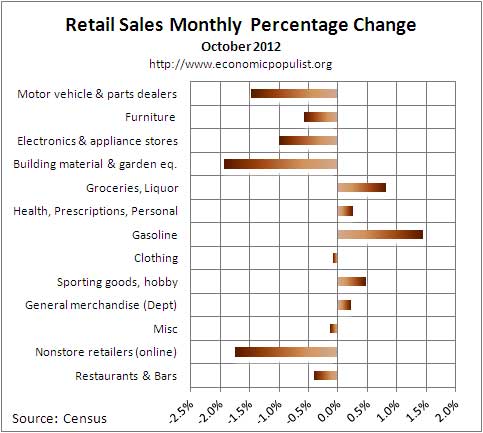
October 2012 Retail Sales decreased, by -0.3%, Autos & Parts alone dropped -1.5% while auto dealers, part of autos & parts sales, declined by -1.6%. Minus autos & parts, retail sales had no change from last month. September's monthly percentage change was revised upward, from 1.1% to 1.3%. Retail sales are reported by dollars, not by volume, so dropping prices often reports as a decline in sales.
For the three month moving average, from August to October in comparison to May to July, retail sales have increased 2.0%. In comparison to a year ago, retail sales are up 3.8%.
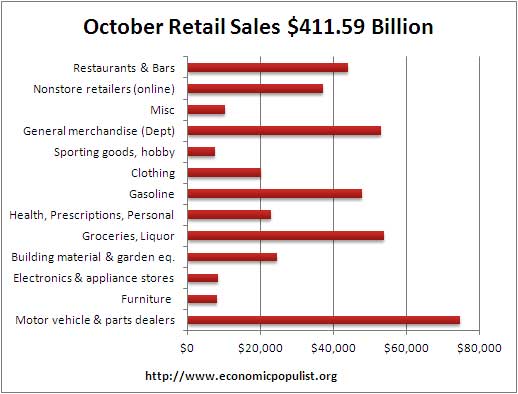
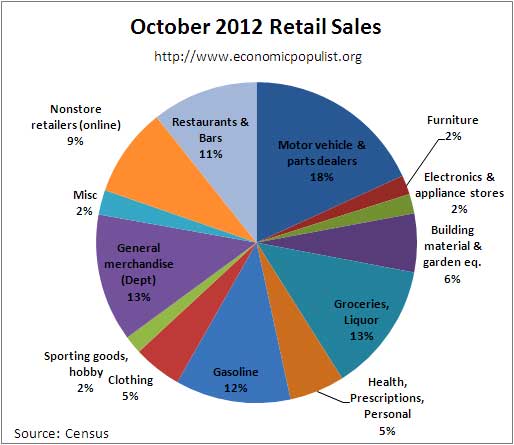
Total retail sales are $411.6 billion for October. Below are the retail sales categories monthly percentage changes. These numbers are seasonally adjusted. General Merchandise includes super centers, Costco and so on. We see retail sales increased only on goods primarily driven by higher prices such as groceries and gasoline. The other declines across the board are really not good news for consumer spending.
Retail trade sales are retail sales minus food and beverage services. Retail trade sales includes gas, and is down -0.3% for the month, up 3.8% from last year. Gasoline station sales have increased 7.7% from one year ago and on-line retailers are clearly expanding, their sales have increased 7.2% from last year.
Below are the October retail sales categories by dollar amounts. As we can see, cars are king when it comes to retail sales. We also see that electronics is much smaller by total dollars. We have no idea how Apple manages to get their product launches reported as front paged news and leading stories. Realty shows cell phones as a market doesn't compare to autos & parts.
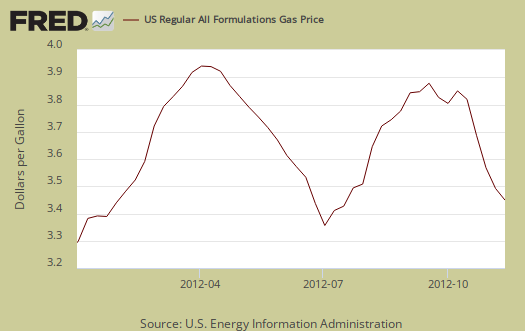
For reference sake, graphed below are weekly regular gasoline prices, so one can see what happened to gas prices in October.
The below chart breaks down seasonally adjusted retail sales by category as a percentage of total October sales by dollar amounts. One can see how dependent monthly retail sales are on auto sales by this pie chart. We also see non-traditional retailers making strong grounds on traditional general merchandise stores.
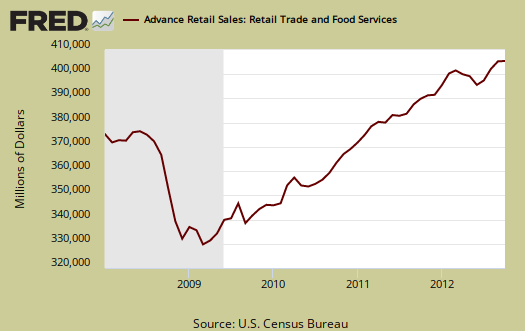
Retail sales correlates to personal consumption, which in turn is about 70% of GDP growth. Yet GDP has inflation removed from it's numbers. This is why Wall Street jumps on these retail sales figures. Below is the graph of retail sales in real dollars, or adjusted for inflation, so one gets a sense of volume versus price increases. Below is the annualized monthly percentage change in real retail sales, monthly, but only up to last month.
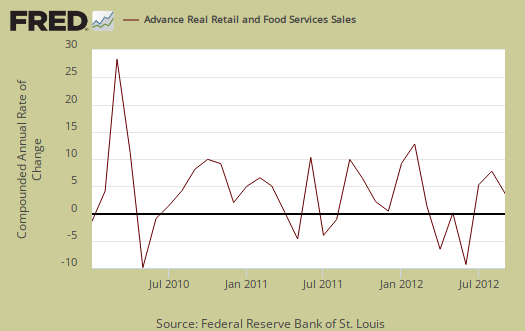
To obtain real values, retail sales are deflated using CPI. Below are the real retail sales quarterly annualized percent change. October would be the first month for Q4, not displayed in the below graph.

Below is a graph of real PCE against real retail sales, quarterly. See how closely the two track each other? PCE almost looks like a low pass filter, an averaging, removal of "spikes", of real retail sales. Here are our overviews for PCE. Here is our overview of Q3 GDP.

Retail sales are not adjusted for price increases, not reported in real dollars. Real economic growth adjusts for inflation. Retail sales has variance, margins of error, and is often revised as more raw data comes into the U.S. Department of Commerce (Census division). For example, this report has an error margin of ±0.5%. Data is reported via surveys, and is net revenues of retail stores, outlets. Online retail net revenues are asked in a separate survey of large retail companies (big box marts). This is also the advanced report. To keep the monthly nominal percentage changes in perspective, below is the graph of monthly percentage changes of retail sales since 2008.
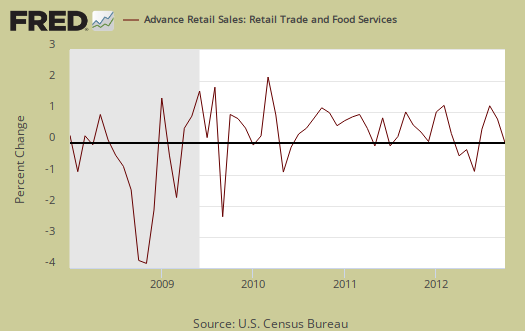
Seasonal adjustments are aggregate and based on events like holidays associated with shopping, i.e. the Christmas rush.
Advance reports almost always are revised the next month as more raw sales data is collected by the Census.
Here is our retail sales topic category.
Recent comments