
The State Unemployment statistics for September 2011 were released. These 10 states, plus the D.C. area, in order, have unemployment rates at or above 10%: Nevada, 13.4%, California, 11.9%, Michigan 11.1%, South Carolina, 11.0%, District of Columbia, 11.1%, Florida, 10.6%, Mississippi, 10.6%, Rhode Island, 10.5%, North Carolina, 10.5%, Georgia 10.3%, Illinois, 10.0%. Sixteen States and the District of Columbia are above the national unemployment rate of 9.1%. Below is the BLS map of unemployment rates for each state.
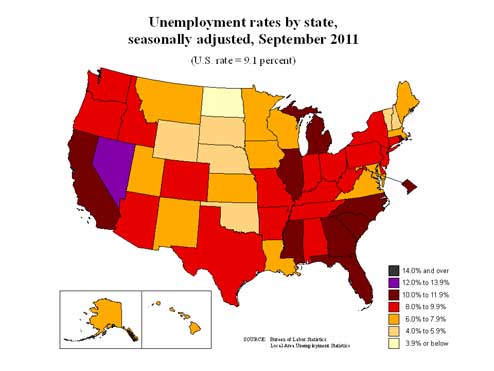
Twenty-five states recorded unemployment rate decreases, 14 states posted rate increases, and 11 states and the District of Columbia had no rate change.
Payroll jobs for the month look bleak and declined in the half of States:
Nonfarm payroll employment decreased in 25 states, increased in 24 states and the District of Columbia, and was unchanged in 1 state.
The largest over-the-month decrease in employment occurred in North Carolina (-22,200), followed by Ohio (-21,600) and Pennsylvania (-15,800).
The largest over-the-month increase in employment occurred in Florida (+23,300), followed by Texas (+15,400) and Louisiana (+14,100).
New Hampshire experienced the largest over-the-month percentage decline in employment (-0.9 percent), followed by New Mexico (-0.7 percent) and North Carolina (-0.6 percent).
The District of Columbia experienced the largest over-the-month percentage increase in employment (+1.6 percent), followed by Hawaii (+1.1 percent) and Louisiana and Mississippi (+0.7 percent each).
Below are States' employment to non-institutional population ratios for 2010. As we can see some states have artificially low rates. This can be due to an increased population of retirees who are part of the non-institutional civilian population, but also can be an increase in people who have given up and are not counted as part of the labor force.
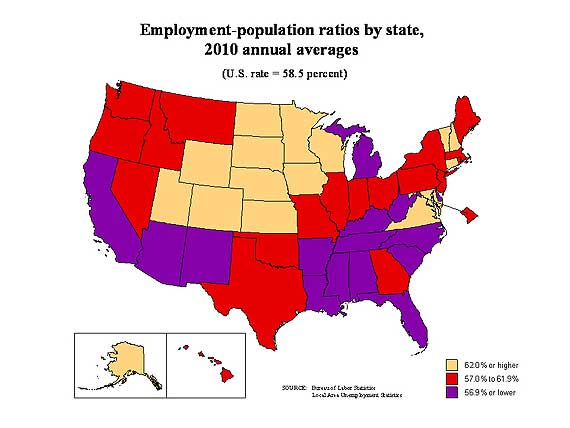
Bottom line, when looking at payroll changes across states, one must take into account that states population, which is why the actual official unemployment rates matter.
The BLS also gave a table of current employment rates per state versus historic highs and lows. Seems 1983 was a pretty bad year although unemployment rates fairly rapidly declined, unlike now.
Below is the BLS map for the total change in nonfarm payrolls, i.e. jobs, for the past year, or since August 2010.
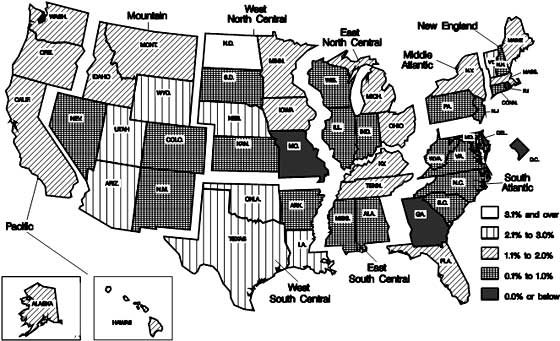
Except for North Dakota, unemployment at 3.5%, followed by Nebraska with an unemployment rate of 4.2%, South Dakota 4.6%, New Hampshire 5.4%, it's like the entire nation is almost static, stuck in time, with just no real job growth and high unemployment rates. Every month is almost identical, with the statistical report release headline stating little changed. The jobs crisis is ongoing.
Over the year, nonfarm employment increased in 47 states, decreased in 2 states and the District of Columbia, and was unchanged in 1 state. The largest over-the-year percentage increase occurred in North Dakota (+5.3 percent), followed by Utah and Wyoming (+3.0 percent each). The largest over-the-year percentage decrease in employment occurred in Delaware (-1.5 percent), followed by Georgia (-0.6 percent).
Here is the overview of last month's state unemployment statistics.
Recent comments