
The October 2010 U.S. trade deficit decreased $3.9 billion to $38.7 billion. September's trade deficit was revised to $44.6 billion. Exports increased $4.9 billion and imports decreased $0.9 billion. That's a 13.2% trade deficit decrease in a month. Exports alone increased 3.19% in October, which is a long time coming.

Imports were 1.24 times larger than exports for October, or in other words, for every dollar we export, we import $1.24 worth of stuff. That said, this report is a huge improvement, last month the ratio was 1.29.
For the year, the deficit is up $6.4 billion, with exports are up 14.9% while imports have increased 15.9%.
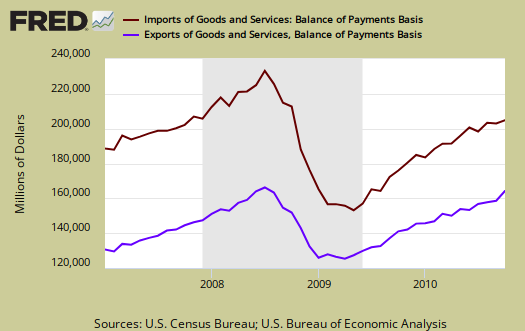
Below are imports vs. exports of goods and services from January 2007 to September 2010. Notice how much larger imports are than exports.
Below is the list of good export increases from September to October.
- Industrial supplies and materials: $2.6 billion
- Foods, feeds, and beverages: $0.7 billion
- Automotive vehicles, parts, and engines: $0.4 billion
- Capital goods: $0.4 billion
- Cther goods: $0.1 billion
- Consumer goods: $0.1 billion
Goods import changes:
- Industrial supplies and materials: -$1.7 billion
- Capital goods: -0.9 billion
- Foods, feeds, and beverages: -$0.1 billion
- Consumer goods: $1.3 billion
- Cther goods: $0.3 billion
Automotive related trade was basically unchanged. On services, exports increased $400 million while imports increased $200 million.
Some better news on advanced technology products too, exports exceeded imports in the monthly change.
Advanced technology products exports were $23.7 billion in October and imports were $32.2 billion, resulting in a deficit of $8.4 billion. October exports were $0.8 billion more than the $23.0 billion in September, while October imports were $0.2 billion more than the $31.9 billion in September.
Here is the breakdown with major trading partners, not seasonally adjusted . China is the worst trade deficit, with $25.5 billion. That said, last month was a $27.8 billion dollar trade deficit with China, a not seasonally adjusted decrease of 8.3%.
Also astounding is the OPEC trade deficit (read oil imports), dropped from $8.9 to $5.7 billion, knocking it down from 2nd place as our worst trading partner to #4.
The October figures show surpluses, in billions of dollars, with Hong Kong $1.9 ($2.3 for September), Australia $1.3 ($1.2), Singapore $0.6 ($0.7), and Egypt $0.5 ($0.6).
Deficits were recorded, in billions of dollars, with China $25.5 ($27.8), European Union $7.1 ($6.1), Mexico $5.8 ($5.8), OPEC $5.7 ($8.9), Japan $5.7 ($5.0), Germany $3.3 ($2.7), Ireland $2.7 ($2.2), Nigeria $1.8 ($2.5), Venezuela $1.2 ($1.9), Korea $1.1 ($1.3), Canada $1.1 ($0.9), and Taiwan $1.0 ($0.9).
Below is the raw customs basis accounting of the trade deficit with China, not seasonally adjusted. China alone is 48.6% of the trade deficit. On a Balance of Payments basis, not seasonally adjusted, so far this year the trade deficit is -$539,468 billion, a 31.2% increase from last year.

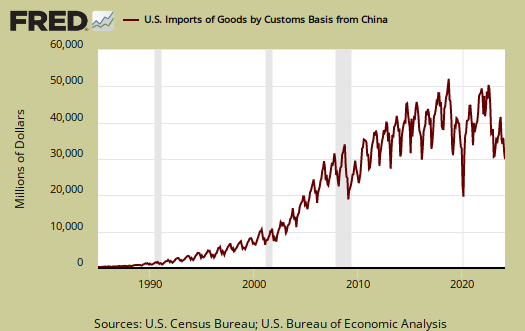
Below is a graph of China imports into the United States from 1985, to show just how much imports from China have grown. The visual is stunning, it looks like a rocket pointed directly at the U.S. economy.
Going into the details.....
By end use categories, not chain weighted dollars, the increased exports of Fuel Oil, Gas, Petroleum products and organic chemicals. The change in soybean exports alone was $569 million.
In October, there was a drop of -$2.31 billion in crude oil imports.
Beyond the change in oil exports and imports, nothing really stands out to explain a production shift.
To get a feel for what's going on in terms of imports and exports by end-use categories, I suggest looking over exhibits 7 & 8 from the trade report.
Here is September's report (unrevised).
Subject Meta:
Forum Categories:
| Attachment | Size |
|---|---|
| 360.06 KB |
Recent comments