
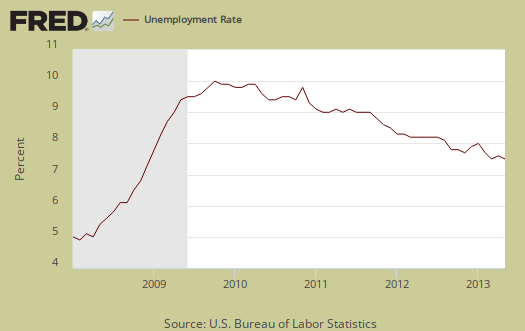
The BLS employment report shows the official unemployment rate ticked up 0.1 percentage point to 7.6% and the current population survey unemployment figures are a static pool of going nowhere fast statistics. More people were employed, yet the number of people stuck in part-time jobs barely budged from last month and the number of unemployed also increased. The labor participation rate increased 0.1 percentage points from the May 1979 record low. U-6, a broader measure of unemployment, ticked down -0.1 percentage point to 13.8%. Overall the CPS statistics look like an oscillating wave of stuck in neutral. This article overviews and graphs the statistics from the Current Population Survey of the employment report.
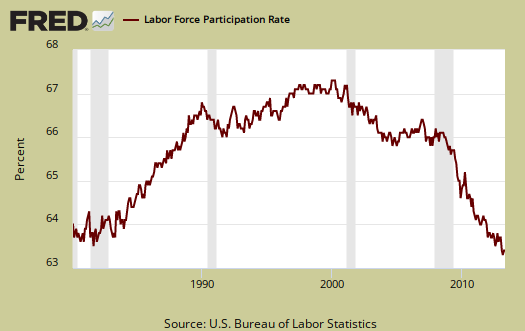
The labor participation rate is 63.4%, mentioned above. The labor participation rate is at artificial lows, where people needing a job are not being counted. The labor participation rate only increased a 10th of a percentage point which means that those who dropped out of the labor force are mostly staying out of the labor force. For those claiming the low labor participation rate is just people retired, we proved that false by analyzing labor participation rates by age.
The number of employed people now numbers 143,898,000, a 319,000 monthly increase. We describe here why you shouldn't use the CPS figures on a month to month basis to determine actual job growth. These are people employed, not actual jobs. In terms of labor flows, the employed has increased 576,000 since January 2013. From a year ago the employed have risen 1.596 million, but bear in mind the noninstitutional population has also increased by 2.397 million during the same time period. The statistics from the CPS do generally vary widely from month to month. Below is a graph of the Current Population Survey employed.

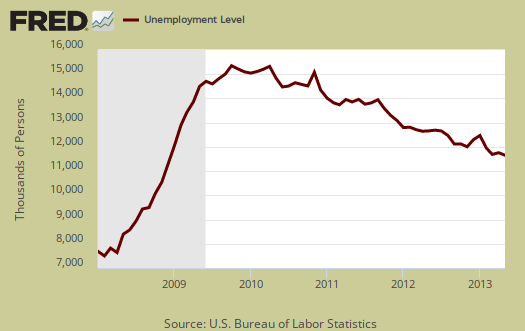
Those unemployed stands at 11,760,000, an increase of 101,000 from last month. Since May 2012 the unemployed has declined by -935,000. Since January, the number of people considered unemployed as dropped by -572,000. While this figure is around the number of newly employed, bear in mind people enter the labor force for the first time and the United States counted imported foreign guest workers in their employment statistics. This means many people simply fell off of the BLS radar screen for being counted at all and are considered instead not in the labor force. Below is the change in unemployed and as we can see, this number also swings wildly on a month to month basis.

The number of people counted as unemployed has also remained fairly static for years now. In terms of labor flows we don't see much slope, or change in the number of unemployed. Below is a graph of the unemployed.
Below is a graph of those considered employed, in maroon, scale on left, against those considered unemployed, in blue, scale on right, by the BLS methods. It is only recently that the growth rate of the employed has exceeded the growth rate of the unemployed (the maroon line exceeding the blue line).

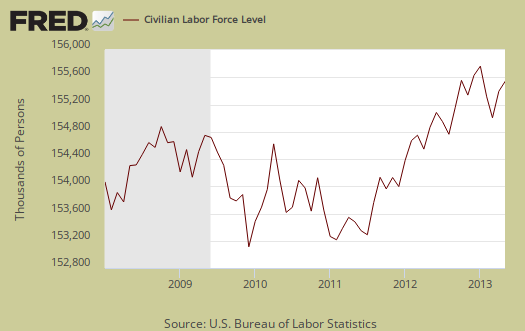
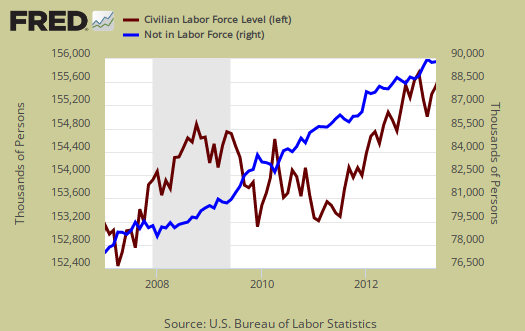
The civilian labor force, which consists of the employed and the officially unemployed, is now at 155,658,000. This is an increase of 420 thousand from last month, mainly due to labor force re-entrants, which increased by 182 thousand and less people lost their jobs, which decreased by -263,000, Notice in the graph below how many more people are in the labor force than at the start of the 2008 recession. Population increases every month and this post gives details on that increase, while this one describes BLS labor concepts as well as how many jobs are needed just to keep up with the increased population.
It's fairly clear the American workforce is ending up in the not counted statistics overall, yet for this month, those not in the labor force now tallies to 89,705,000, a decline of -231,000 from last month. From a year ago, those considered not in the labor force has grown by 1.737 million. Below is the change to show on a month to month basis, the CPS shows quite a bit of variance. We talk about the wild monthly CPS changes in this post.

Below is a graph of the civilian labor force, in maroon, scale on left, against those not in the labor force, in blue, scale on right. Notice how those not in the labor force as a trend exceeds those considered employed and unemployed. What we see is a never ending growing segment of the population that is considered neither employed or unemployed, i.e. not in the labor force, increasing, above the trend line of those who would be naturally dropping out, such as the retired and those in school. Not in the labor force figures do include retirees.
Those considered employed as a ratio to the total Civilian noninstitutional population stands at 58.6%, which had no change from last month. This ratio hasn't been this low since October 1983, not counting past 2008. This implies there are many people who could be part of the labor force who are not anymore, as shown in the graph below.

A huge problem with today's labor market is the gross number of working part-time generally. There are a huge number of people who need full-time jobs with benefits who can't get decent career oriented positions. Those forced into part time work is now 7,904,000, an decrease of -12,000 from last month and has barely budged from a year ago, with a drop of -212,000. This is a hell of a lot of people stuck with part-time hours who need full-time work. Of those considered employed, a whopping 18,934,000 of them are in part-time jobs, for whatever reason. That's 13.2% of people employed are in part-time jobs, a very high ratio.

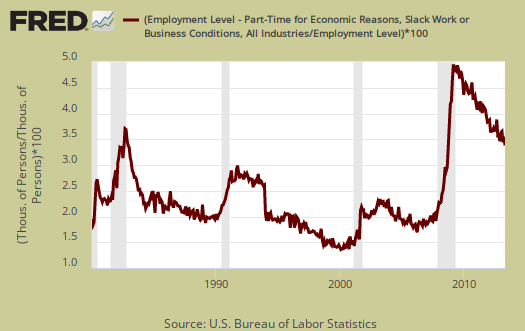
Below is a graph of forced into part-time work because they got their hours cut, graphed as a percentage of the total employed. Part-time due to cut hours is known as slack work conditions and consisted of 4,841,000 people for May. This is an decline of -288,000 from last month. Below is a graph of forced part-timers due to slack work conditions as a percentage of the civilian labor force. We think this graph is a recession economic indicator, and notice the slope matches strongly the gray recession bars of the graph. The percentage of people in working part-time due to slack economic conditions has stayed extremely high since the start of the Great Recession, as a trend, even with this month's decline.
U-6 is a broader measure of unemployment and includes the official unemployed, people working part-time hours because that's all they can get and a subgroup not counted in the labor force but are available for work and looked in the last 12 months. Believe this or not, the U-6 alternative unemployment rate still leaves out some people wanting a job who are not considered part of the labor force. U-6 decreased -0.1 percentage points to 13.8%. The reason for the decrease in U-6 is the decline in those marginally attached to the labor force.

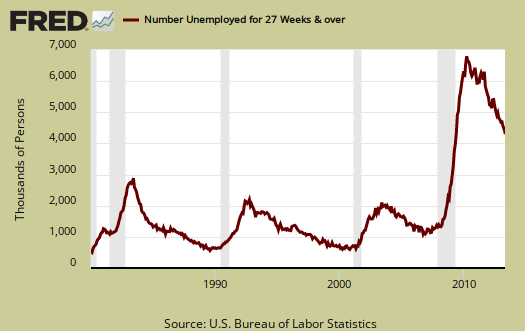
The long term unemployed, or those unemployed for 27 weeks and over, stand at 4,357,000 people. This is an increase of 4,000 from last month. The long term unemployed are the crisis of our time and this figure decrease does not necessarily imply those unemployed for a long time are actually finding jobs. The long term unemployed are now 37.3% of the total unemployed and this percentage decreased 0.1 percentage points from last month. As part of sequestration, millions of long term unemployed just got their unemployment benefits cut by 10% or more. In California, long term UI benefits were reduced by 18%. Unemployment benefits or Initial claims statistics are not how the BLS counts the unemployed.
The marginally attached are people not in the labor force because they have not looked for a job in the last month, but have looked for a job in the last year. This number has ballooned since 2007 and not returned to pre-recession levels. The graph below is the number of people considered marginally attached to the labor force, currently at 2.164 million. This is a decrease of -183,000 from a year ago.
Discouraged workers are people, not counted as part of the civilian labor force, who not only want a job, but also looked for one in the last year. These people aren't job hunting now because they believe there are no jobs out there. Below is the graph of discouraged workers, currently at 780 thousand people and are a subset of the marginally attached. Discouraged workers is kind of a barometer for how the job market is perceived.

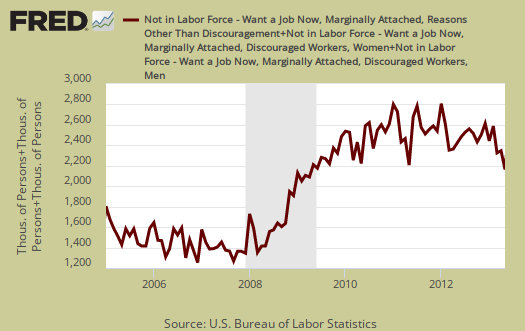
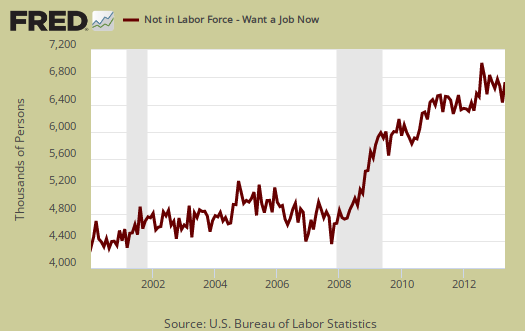
One of our favorite statistics from the CPS survey is how many people who are considered not in the labor force, want a job now. It is a direct survey question from the CPS. The survey asks people who are not being counted in the unemployment statistics and official unemployment rate if they want a job. The number who answer yes currently stands at 6,712,000. This is a 299 thousand person increase from last month. There isl an astounding number of people not counted who report they actually want a job and roughly 2 million higher than before the recession. This figure includes the discouraged workers and marginally attached, but is seasonally adjusted, unlike the above.
The average length of unemployment is now 36.9 weeks, an increase of 0.4 weeks from last month. This still is an absurdly long amount of time to be unemployed and has stayed highly elevated for years. The average duration is also so high due to the long-term unemployed, who clearly are having a hell of a time getting a job, many facing age discrimination.

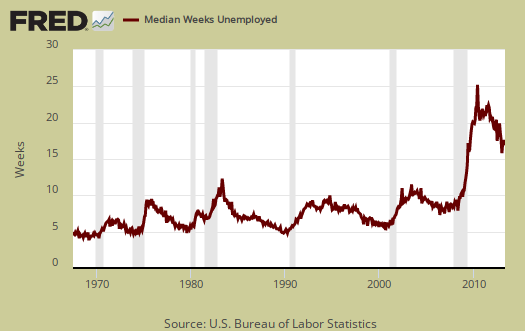
The median time one is unemployed, which means 50% of people have gotten a job in this amount of time, and is 17.3 weeks, an decrease of 0.2 weeks from last month.
Those unemployed less than five weeks increased by 232 thousand, those unemployed between five weeks and 14 weeks decreased by -179 thousand and people who had been unemployed for 14 weeks to 26 weeks also decreased by -17,000. As previously noted, the long term unemployed increased by 4 thousand. For the month is appears our unemployed are simply moving through the duration queue. A drop in the unemployed does not necessarily mean they found a job either.
Here is our overview of last month's CPS unemployment statistics.
Recent comments