
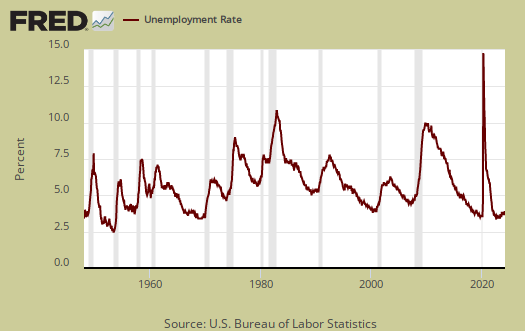
The January 2016 unemployment report is being reported as nothing but good news. The official unemployment rate is 4.9%, a rate not seen since February 2008. This is the weird month where annual population adjustments are applied and not backwards adjusted. Therefore January to December comparisons are not valid. Still, there are some trends to look at. The labor participate rate is a very low 62.7% and those not counted in the unemployment rate who say they want a job is almost six million. Overall, this month's CPS report shows a mediocre unemployment situation for most, in spite of the official unemployment rate breaking five percent.
This article overviews and graphs the statistics from the Employment report Household Survey also known as CPS, or current population survey. The CPS survey tells us about people employed, not employed, looking for work and not counted at all. The household survey has large swings on a monthly basis as well as a large margin of sampling error. This part of the employment report is not about actual jobs gained but people and their labor status.
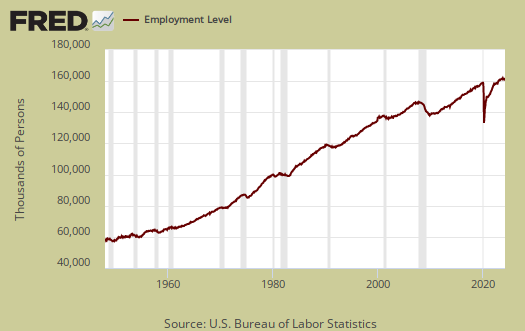
Those employed now stands at 150,544,000. From a year ago, the ranks of the employed has increased by 2.44 million.
Those unemployed number 7,791,000. From a year ago the unemployed has decreased by -1,129,000.

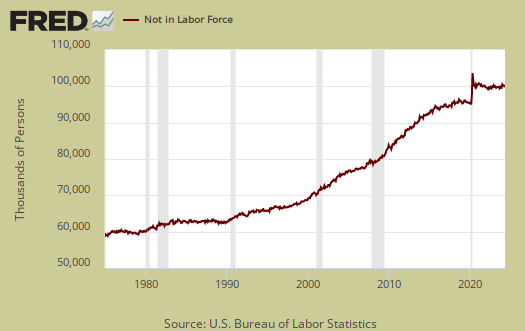
Those not in the labor force is 94.062 million. The below graph are the not in the labor force ranks. Those not in the labor force has increased by 1,363,000 in the past year.
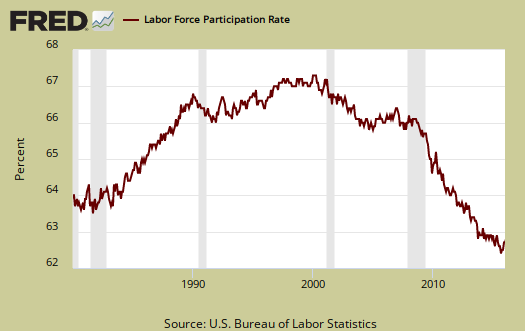
The labor participation rate is 62.7%, Recent upward movement is taken as a very good sign, yet this is still a low not seen since February 1978.
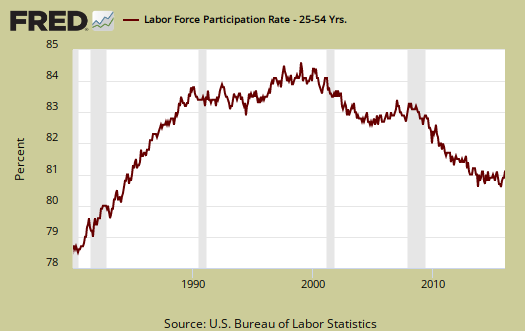
Below is a graph of the labor participation rate for those between the ages of 25 to 54. The rate is 81.1%, a level not seen since January 1985. These are the prime working years where one should not see record low participation rates or see what appears to be oscillation since the 2008 financial crisis.
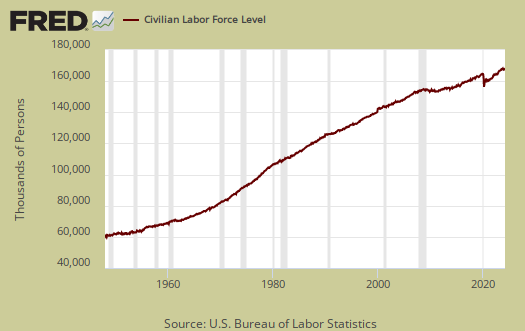
The civilian labor force, which consists of the employed and the officially unemployed, stands at 158,335,000. The civilian labor force has grown by 1,310,000 over the past year. New workers enter the labor force every day from increased population inside the United States and immigration, both legal and illegal.
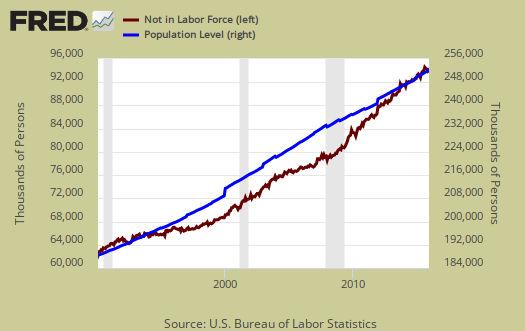
Those not in the labor force now grows less the population which has the potential to work, a very recent trend reversal. Below is a graph of those not in the labor force, (maroon, scale on the left), against the noninstitutional civilian population (blue, scale on the right). &n bsp; Notice how those not in the labor force crisscrosses the noninstitutional civilian population in growth and the accelerated growth started happening in 2008.
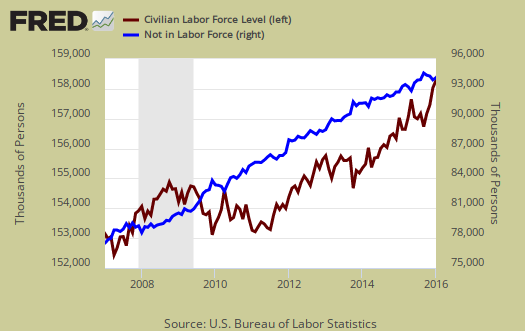
Below is a graph of the civilian labor force, or the official employed plus unemployed, in maroon, scale on left, against those not in the labor force, in blue, scale on right. See how those not in the labor force as a trend exceeded those considered employed and unemployed starting around mid 2009. Starting in 2014 it has reverted back, yet look at how is it reverted once again in 2015 and now swinging back. This shows those not in the labor force has been growing much faster than those obtaining jobs and being counted as looking for work. Those not in the labor force does include retirees and students.
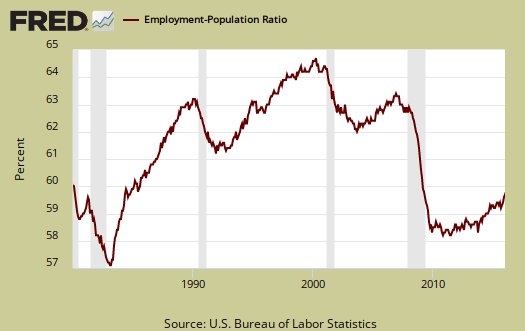
Those considered employed as a ratio to the total Civilian noninstitutional population now stands at 59.6%, a level not seen since August 1984, barring the financial crisis aftermath. The relationship between the employment-population ratio and the labor participation rate (LPR) is: employment-population ratio = LPR * (1 - unemployment rate).
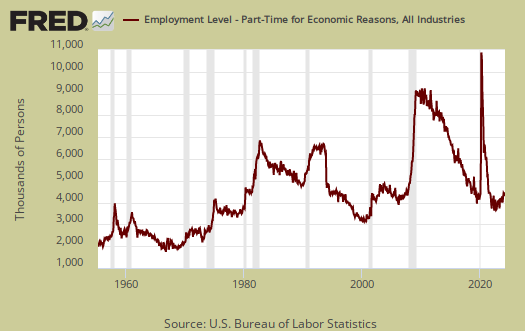
Those forced into part time work for economic reasons stands at 5,998,000 people. The annual decrease is now -796 thousand.
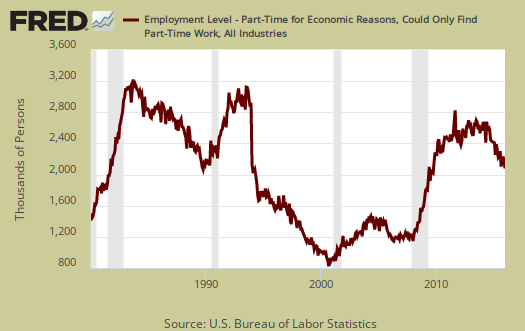
There are two categories of those forced into part-time jobs due to economic circumstances. Those who could only get part-time jobs and those already working who got their hours cut due to businesses not having enough work for them. The number of people who could only get part-time jobs stands at 2,134,000 as shown below.
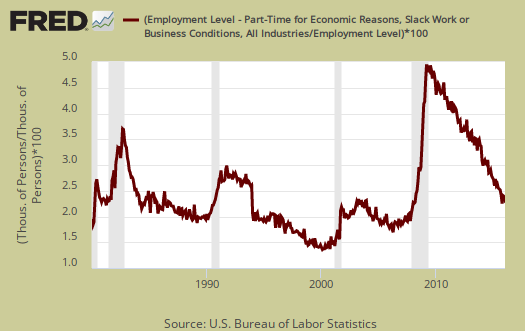
People can also work part-time hours due to slack business demand. People who got their hours cut due to slack working conditions stands at 3,544,000. Below is a graph of forced into part-time work because they got their hours cut, as a percentage of the total employed. This is a recession economic indicator.
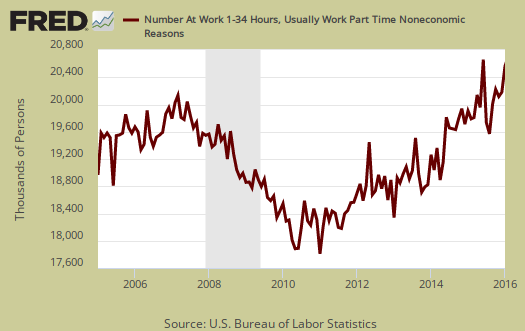
Part-time workers who are voluntarily working part-time jobs is a whopping 20,311,000.
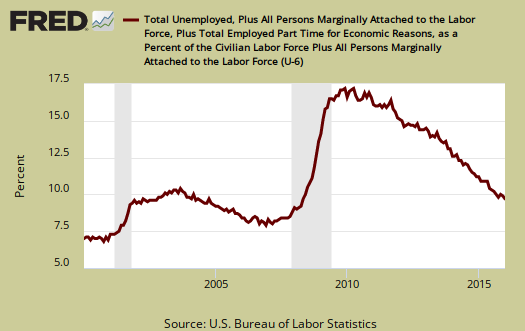
U-6 now stands at 9.9% U-6 is a broader measure of unemployment and includes the official unemployed, people working part-time hours because that's all they can get and a subgroup not counted in the labor force but are available for work and looked in the last 12 months. The U-6 rate still leaves out some people wanting a job who are not considered part of the labor force, so while it is called an alternative rate, but it still ignores many who should be counted as unemployed.
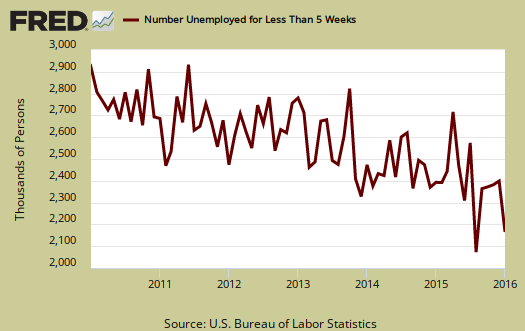
The newly unemployed stands at 2,249,000. Below is a graph of those unemployed for less than five weeks.
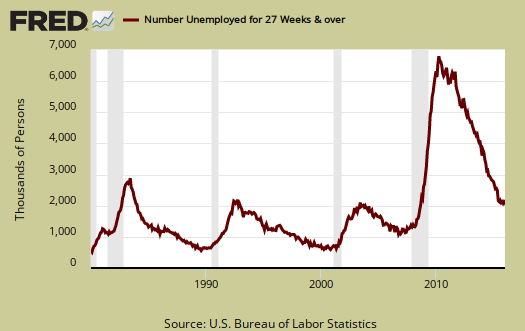
The long term unemployed, or those unemployed for 27 weeks and over, is 2,089,000 people. From a year ago the long term unemployed ranks has declined by -687,000.
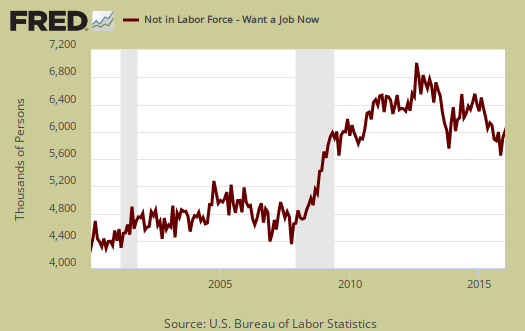
Within the CPS survey is how many people who are considered not in the labor force who report they want a job now. It is a direct survey question. The Census asks people who are not being counted in the unemployment statistics and official unemployment rate if they want a job. The number who answer yes currently stands at 5,973,000. Those who are not counted yet report they want a job includes the discouraged workers and marginally attached and is seasonally adjusted. This figure has not changed from a year ago.
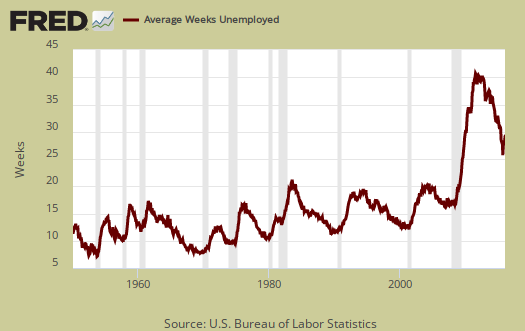
The average length of unemployment is 28.9 weeks. The average time to be unemployed has stayed completely out of line with the median duration.
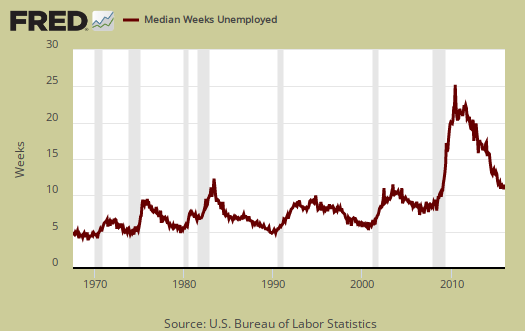
The median time one is unemployed, which means 50% of people have gotten a job in this amount of time is 10.9 weeks. A year ago the median time to be unemployed was 11.3 weeks.
This month's CPS report gives a nice headline number of the unemployment rate dropping to an eight year low, yet it is clear labor conditions have some way to go. Other elements show there are many who are not in the labor force who would be. Here are our past overviews CPS unemployment statistics, only graphs revised.
Recent comments