
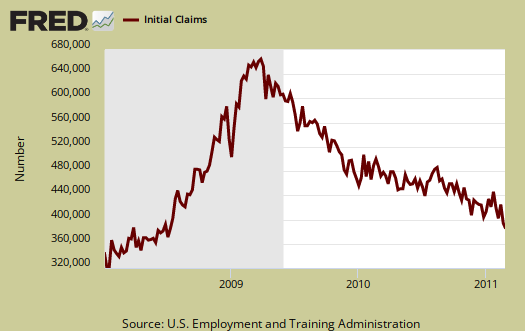
Initial weekly unemployment claims decreased to 368,000 this week and last week was revised down to 388,000. The 4 week moving average dropped below 400,000 to 388,500. This is the first time in July 2008 this has happened.
The magic number to show job creation is at minimum, below 400,000 initial unemployment claims per week and most Economists will quote 375,000. Are we finally seeing initial claims drop off?
From the jobless claims report:
In the week ending Feb. 26, the advance figure for seasonally adjusted initial claims was 368,000, a decrease of 20,000 from the previous week's revised figure of 388,000. The 4-week moving average was 388,500, a decrease of 12,750 from the previous week's revised average of 401,250.
Below is the mathematical log of initial weekly unemployment claims, so one can get a better sense of the rise and fall of the numbers. A log helps remove some statistical noise, it's kind of an averaging. As we can see we have a step rise during the height of the recession, but then a leveling, not a similar decline....for a long period. We have this yo-yo bobblehead, over 400,000 every week on initial claims, never ending labor malaise. Now, notice the tail, it appears a downward slope, a decline initial claims, is emerging in February.
Below is the 4 week moving average, set to a logarithmic scale to remove even more statistical noise, for the last year. Here a trend that is certain would appear. It looks like we have a a solid pattern happening, so keep your fingers crossed, wait and see. Again, we need the 4 week moving average to stay below 400,000 and keep dropping. Numerous economists say the number is 375,000 to show job growth. We see a strong decline, but remember the record highs. We need this number to keep dropping. That said, one can say a pattern has emerged of a downward progression in the 4 week moving average.
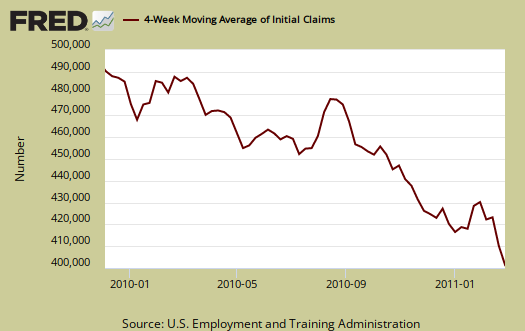
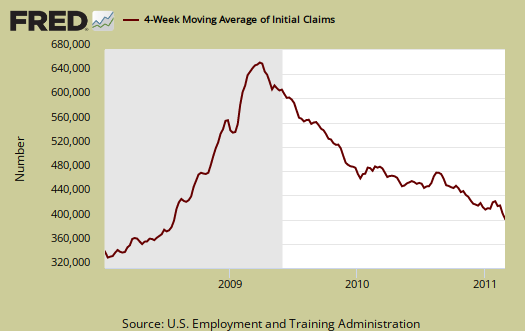
Below is a 2 year view of the 4 week moving average, set to a log scale. This shows while the immediate change looks promising, we are nowhere near pre-recession initial weekly unemployment claims levels.
On continuing claims, those also dropped:
The advance number for seasonally adjusted insured unemployment during the week ending Feb.19 was 3,774,000, a decrease of 59,000 from the preceding week's revised level of 3,833,000. The 4-week moving average was 3,863,750, a decrease of 40,500 from the preceding week's revised average of 3,904,250.
In the week ending February 12th, there were 9,236,041 official people obtaining some sort of unemployment insurance benefit.
Can I please be Mr. Obvious?
As time goes on and people continue to be out of work for time well beyond the limits to collect unemployment, of course the numbers will drop. It in no way means there are more jobs or less unemployed, just that many people simply can't collect it anymore and drop out of the system.
It doesn't take a genius to quickly figure out how bad it is when businesses post openings on Craigslist or in newspapers and get more candidates overnight than they can even consider.
You certainly may!
It's been so bad, often on these reports I put "hasn't everyone in America been fired by now"? So, when tomorrow's unemployment report comes out, I'll be focusing in on the CES survey, or how many actual new jobs are there and even per sector.
It's the most solid metric to say, ok, there were x jobs added with the largest survey.
Also, I cover the JOLTS survey on this site and it shows what you are saying, there is something like 10 people per each job actually open.
It's really horrific.
All this report indicates is a "sniff in the air" things may have improved. Shouldn't be weighted at all like even the monthly unemployment reports.
Government numbers are propaganda
I don't go by the government numbers - they have become mostly propaganda at this point - they don't count people as unemployed if they have been out of work long term and various other fudges.
Instead I would look at:
http://www.shadowstats.com/alternate_data/unemployment-charts
easy to say when you don't know statstics
Shadow stats has it's own problems. There are a host of statistics and more importantly, the raw methods that make the difference. I look into these almost every day and a huge activity is to find the missing unemployed and point out the limitations from each economic report. That said, I've seen incorrect data on shadowstats...
even inaccuracies on the methods being used by the BLS/BEA etc.
so the only way, IMHO to figure out how to read these things is learn about the underlying assumptions, methodologies.