
JOLTS stands for Job Openings and Labor Turnover Survey. The April report shows there were 4.6 official unemployed people hunting for a job to every position available. There were only 2,972,000 job openings for April 2011 and a -4.8% drop from the previous month. Below is the graph of job openings per the official unemployed.
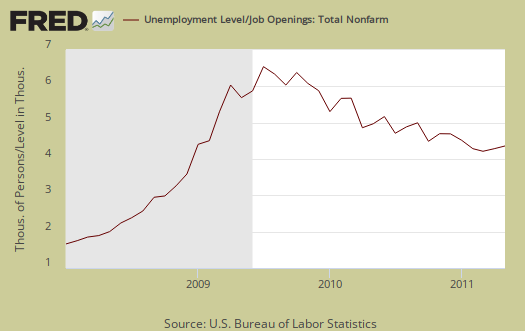
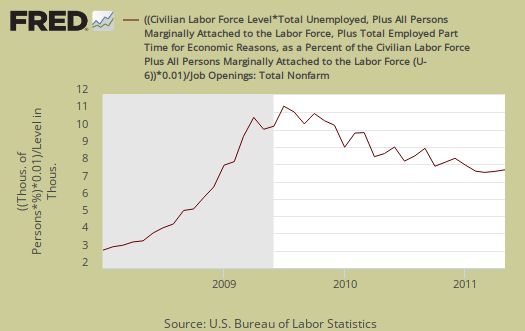
If one takes the official broader definition of unemployment, or U6, currently at 15.8%, the ratio becomes even worse, 8.2 unemployed people per each job opening.
The job openings rate (2.2 percent), the hires rate (3.0 percent), and the separations rate (2.9 percent) were essentially unchanged in April.
Below are raw job openings, way below pre-recession levels.
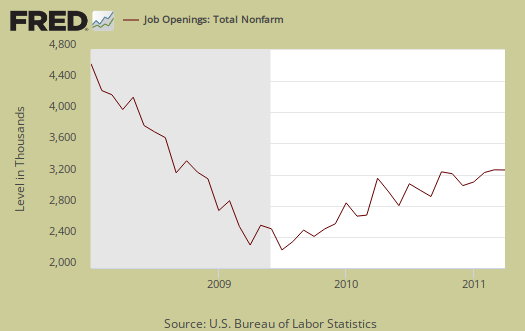
Believe this or not, since the so called end of the Great Recession, job openings have only increased 549,000. That's pathetic.
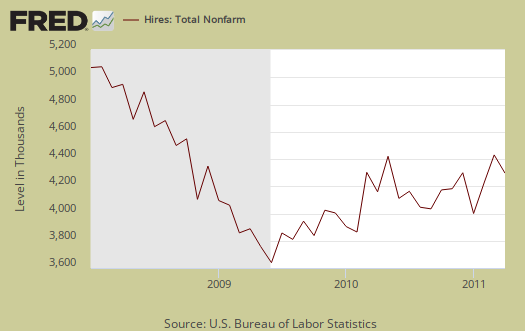
We can see some of this in the actual hires from April, note the dramatic decline and the slight downturn in April. Hires were down -2.3% from March 2011.
At 4.0 million in April, the number of hires has increased from 3.6 million in October 2009 (the series trough) but remains below the 5.0 million hires in December 2007 when the recession began.
Below are total job separations, 3,743,000, with the term separation meaning you're out of a job through a layoff, quitting or retirement. Notice how separations is almost equal to the number of hires, 3,972,000. Seems the revolving door has come to working America, although not quite the same as the one in Washington D.C.

The number of quits or voluntary job separations is becoming dangerously close to the number of fires. Want a choice of employers? Doesn't seem to be much of an option today.
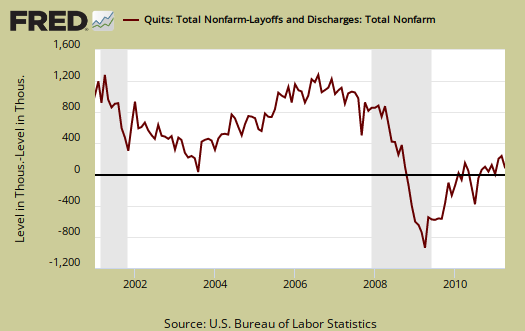
Since the end of the recession, the proportion of layoffs and discharges has declined; however, the proportion of quits has not returned to pre-recession levels. In April, the proportion of quits for total nonfarm was 50 percent and the proportion of layoffs and discharges was 41 percent. The proportion of quits for total private was 51 percent and the proportion of layoffs and discharges was 41 percent.
Below are quits minus discharges and layoffs. What this graph shows is how people do not have a choice in jobs, the number of people being forced out of their job is more equaling the number who plain quit, which implies little choice and those who have a job are hanging on for dear life.
The JOLTS takes a random sampling of 16,000 businesses and derives their numbers from that. The survey also uses the CES, or current employment statistics, not the household survey as their base benchmark, although ratios are coming from the household survey, which gives the tally of unemployed.
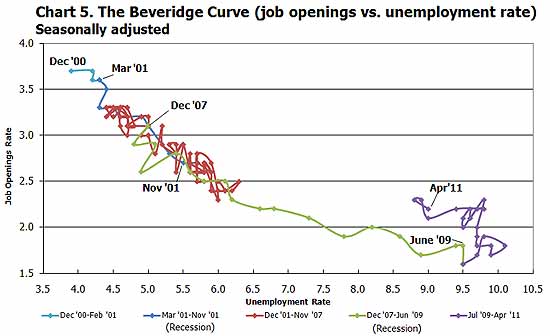
The BLS was kind enough to make a credible Beveridge Curve graph, reprinted below. The Beveridge curve shows the official unemployment rate vs. the job openings rate. If you see a bunch of data points to the far right, that's bad, it means there is long term unemployment and not enough jobs. Look at how we're stuck to the right, the green shows how fast we went to the right and stuck there, meaning there are no jobs. This graph shows working America is in big trouble.
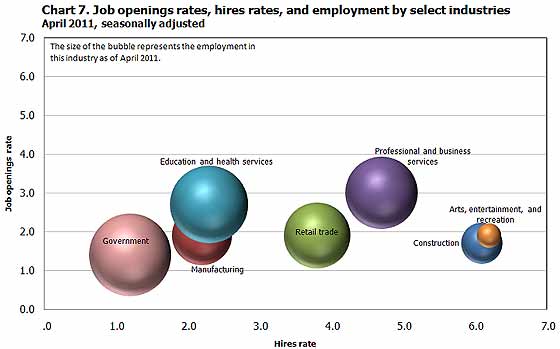
For the JOLTS report, the BLS creates some fairly useful graphs, some of which were reprinted here, and they have oodles of additional information in their databases, broken down by occupational area. The Saint Louis Federal Reserve also had loads of graphing tools for JOLTS. Below is a reprint of the BLS bubble graph, and the first thing to note is how health and educational employment dwarfs manufacturing. For economies of scale, we really need to see that manufacturing bubble grow and grow, it's about 11% of the total economy which is not good for a host of reasons.
To put these ratios into perspective, there were 4.8 million job openings in March 2007 and believe this or not, the low point of job openings was in July 2009.
This report is 1 month behind the unemployment report
Not only should you read this post, even those the BLS release was earlier today, bear in mind April's jobs report said 244,000 were created.
So, this is God terrible considering it's not incorporating May's report.
As always, Robert, thanks for your clear-headed reporting...
...and no-holds-barred analysis.
Not pretending to be an economist
underemploymwnt
Great report. I'm glad to see that someone besides myself is using the underemployment rate regarding JOLTS. "If one takes the official broader definition of unemployment, or U6, currently at 15.8%, the ratio becomes even worse, 8.2 unemployed people per each job opening."
Another issue is that the number of part-time jobs in the JOLTS report. I have not seen the full-time/part-time jobs breakdown. Of those 3 million jobs, a large percentage could be part-time positions. In fact, the unemployment rate for those seeking full-time work is 9.7%, while for those seeking part-time work the unemployment rate is much less at 6.3% http://www.bls.gov/news.release/empsit.t10.htm.
Keep up the great work. No one in the MSM is accurately presenting unemployment. The 9.1% spiel is simply the best case scenario.
JOLTS, part time, seasonal temp, full
They are all mixed together. I can take the part time job creation numbers from the establishment survey and give a rough estimate. You're right, the report mixes anything even remotely called a job opening.
I know for a fact in tech, they put out phony job openings all of the time, they import foreign workers instead of even considering an American. Or, they are resume harvesting, also not actual intention to hire.
Consider registering for we go over these reports with a comb and especially all of the labor related ones.
I'm registered and
I'll be looking forward to your next analysis. Mike
Unemployment
Where are the jobs/careers? I am a student with over 20 years professional experience. Temp agencies such as Robert-Half/Account Temps,Careerbuilder and others have tons of job posting, but no one is hiring people. The same job ads run until the 30 payment is fulfilled. The Work-Force Commission do not fill jobs either. Why is this allowed? How can people retool themselves, and not be expected to acheive a career? The U.S. job market is a mess, and will it every be fixed. I think if the Good Old Boy systems go away,STOP HIRING PEOPLE YOU KNOW!!!WHO ARE NOT Q FOR THE JOB... People with real skills would be working.
Yeah, but ...
... when people you know are desperately seeking jobs too, and they are qualified enough ... what can we expect of those who do the hiring? Would you turn your back on a friend or even on the son or daughter of a friend? If you do that, pretty soon your friends turn their backs on you and on your sons and daughters. It's more than the notorious 'good ol' boys' -- it's the way of the world.
The only solution is full employment. Start with this: full employment policy as a primary objective demanded by the public!