The June 2011 U.S. trade deficit increased $2.3 billion to -$53.1 billion. This is a 4.4% monthly increase in the trade deficit. Both imports and exports decreased, showing a slowing of global trade. The trade deficit wasn't this big since October 2008. Exports decreased -$4.1 billion, or -2.34% from last month while imports decreased -$1.9 billion, or 0.83%. China imports, not seasonally adjusted, increased 4.9% in June, with a trade deficit of -$26.66 billion.
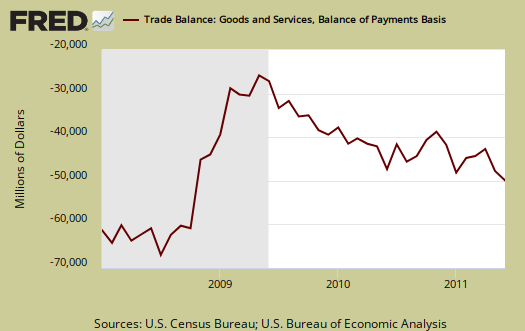
Oil imports came off last month's record highs with a petroleum end use trade deficit of -$29.61 billion, for June, a decrease of -3.2%. Japan imports shot back up as they recover from disaster, $1.15 billion, or 13.79% from May, leading to a monthly Japan trade deficit increase of 53%, not seasonally adjusted. May, last month, the total trade deficit had increased by 16.52%.
Expect Q2 2011 GDP to be revised below 1%, as we noted in the advance GDP overview.
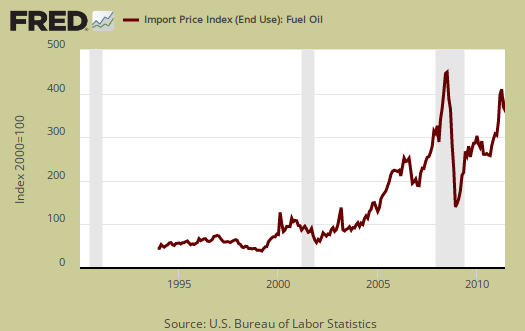
The United States basically has two major ongoing problems with the trade deficit, Chinese goods and Oil imports. Below is the not seasonally adjusted import price index for oil fuel. In June the average price for a barrel of oil was $106.
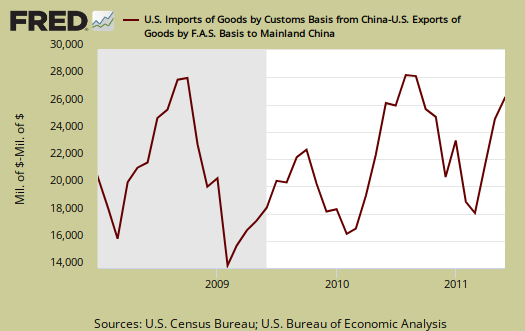
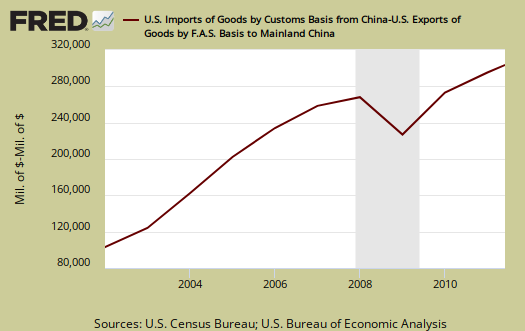
Below is the raw customs basis accounting of the trade deficit with China, not seasonally adjusted. China alone was 37.79% of the goods trade deficit for June. This includes oil. For comparison's sake the not seasonally adjusted goods trade deficit by Census accounting methods was $69.48 billion.
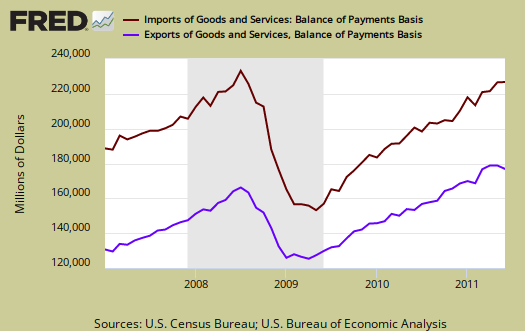
Below are imports vs. exports of goods and services from January 2007 to June 2011. Notice how much larger imports are than exports, but also notice the growth, or rate of change between months of U.S. exports. The June export decline was virtually all goods, services was basically unchanged.
Below is the list of good export decreases from May to June, seasonally adjusted. The drop is due to industrial supplies and materials, which includes fuel oil. Fuel oil was 21.33% of the total export drop in this category. Capital goods also took a major hit with industrial engines and machines being 39.83% of the total decline in capital goods exports.
- Automotive vehicles, parts, and engines: +$0.045 billion
- Industrial supplies and materials: -$2.007 billion
- Other goods: -$0.522 billion
- Foods, feeds, and beverages: -$0.804 billion
- Capital goods: -$1.504 billion
- Consumer goods: +$0.748 billion
Exhibit 7 gives Census accounting method breakdown for exports.
Here are the goods import monthly changes, seasonally adjusted. Notice the trade deficit increased while industrial materials dropped. Oil and Petroleum products was 70.79% of industrial materials imports decline.
- Industrial supplies and materials: -$2.215 billion
- Capital goods: -$0.131 billion
- Foods, feeds, and beverages: +$0.122 billion
- Automotive vehicles, parts, and engines: -$0.176 billion
- Consumer goods: -$0.107 billion
- Other goods: +$0.659 billion
Running a trade deficit in advanced technology is not a good sign for those jobs of tomorrow. This deficit is increasing almost every month, meaning we are literally outsourcing America's future.
Advanced technology products exports were $24.7 billion in June and imports were $33.5 billion, resulting in a deficit of $8.8 billion. June exports were $1.3 billion more than the $23.3 billion in May, while June imports were $2.2 billion
more than the $31.2 billion in May.
Here is the breakdown with major trading partners, not seasonally adjusted. China is the worst trade deficit, with $26.7 billion, with last month's China deficit being $25 billion. We are China's export dumping ground.
OPEC can be assumed to be oil and it increased for June, but is not seasonally adjusted. Still we see every month, our problem is clearly China and oil imports. The amounts in parenthesis are May's deficit figures. Notice how the trade surplus list is super short.
The June figures show surpluses, in billions of dollars, with Hong Kong $2.4 ($2.1 for May), Australia $1.4 ($1.2), Singapore $1.0 ($0.8), and Egypt $0.3 ($0.4).
Deficits were recorded, in billions of dollars, with China $26.7 ($25.0), OPEC $13.8 ($11.3), European Union $9.8 ($8.8), Mexico $6.4 ($6.3), Japan $4.0 ($2.6), Germany $4.0 ($3.8), Venezuela $3.3 ($3.1), Nigeria $3.0 ($2.3), Canada $2.8 ($2.7), Ireland $2.8 ($2.4), Taiwan $1.8 ($1.5), and Korea $1.6 ($1.3).
Once again, we are back on track for record breaking trade deficits, which detract from U.S. GDP, even with a slowing global economy. In 2008, we broke monthly trade deficit figures of $60 billion.
Below is a graph of trade deficit with China, per year. 2010 was a record for a trade deficit with China. With 2011 having a China trade deficit, accumulated of -133.413 billion by June, we're well on our way to break last year's record.
Here is May's report overview (unrevised, although graphs are updated). Here is the BEA website for additional U.S. trade data.
You might ask what are these Census Basis versus Balance of Payment mentioned all over the place? The above mentions various accounting methods so we're comparing Apples to Apples and not mixing the fruit. The trade report in particular is difficult due to the mixing of these two accounting methods and additionally some data is seasonally adjusted and others are not. One cannot compare values from different accounting methods and have that comparison be valid.
In a nutshell, the Balance of Payments accounting method is where they make a bunch of adjustments to not count imports and exports twice, the military moving stuff around or miss some additions such as freight charges. The Census basis is more plain raw data the U.S. customs people hand over which is just the stuff crosses the border. The 2005 chain weighted stuff means it was overall modified for a price increase/decrease adjustment in order to remove inflation and deflation time variance stuff.
Bottom line, you want just the raw data of what's coming into the country and going out, it's the Census basis and additionally the details are only reported in that accounting format. Additionally the per country data is not seasonally adjusted so watch out trying to add those numbers into the overall trade deficit. It's a statistical no-no to mix seasonal and non-seasonally adjusted numbers.
The Census is also getting into the graphing game with some nice pie charts breaking down exports by country, as well as a chart showing petroleum as an overall percentage of the trade deficit. No surprise China eats the pie on goods imports, yet where oil is on their chart is a mystery due to not showing OPEC grouped.

Deficit Solution: FREE trade agreement with Korea
The U.S. trade deficit unexpectedly increased in June to the highest level since October 2008, yet, Obama, Mr. "I'll renegotiate NAFTA", wants Congress to pass yet another one-sided "free" trade agreement with Korea.
Just what we need to solve our trade deficit problems - more "free" trade agreements with Korea and Panama.
exactly what I was thinking
I'm going to try to write up a new Trade via policy post later, for I heartily agree, and what's more frightening is we have so called Academics, so called Economics PhDs bold faced, claiming we need more bad trade deals which lost jobs.
I'm sorry, what is it with these people that they cannot see, the massive trade deficit statistics!
It's scary because these idiots determine what graduate students get a PhD, so what....if you don't chant the insanity of the free trade church, claiming the emperor is clothed, you do not obtain your degree?
Unbelievable.
Free Trade Flaws
see:
The Great Flaw in the Free Trade Theory ...
I like the blog
It's a great investor-oriented blog, especially as providing a window to how it looks from Europe.
Of course, I agree about 99% with the socio-economic and philosophical ideas presented there occasionally.
How the US has historically used mineral rushes to get it out of
In the US's historical past the Druids have used and impressed upon the US leadership to use mineral resources to stop economic warfare, along with military take over. Some simple examples of the economic warfare strategy of mineral rushes to spread the US out and create US wealth to get us out of a Deficit situation are Fort Sumter. Where a long time Druid camp had made noticeable their secret chambers ability to gain wealth from the area via mass pys do name cognition. Alaska was before or after Fort Sumter but was done by the US government the same way to help US citizens create tons and spread out the wealth in the US. Along with get us out of a deficit during that time. The reason for both of these was because Russia at the time was planning to invade the Area's and take them from US. In which we had to do something to stop them from doing that. Along with that during the Cold War the US used production mineral rushes to keep our production and manufacturing here in the US. Which allowed companies to have down the road access to minerals which was much cheaper than the Soviet Empire almost monopoly on the worlds resources.
Today we see a similar problem. The Communist Chinese MSS have used their militarized economy. Where they do such military things as fund terrorist and genocidal dictators to get cheap resources to keep their economy at the top of the surplus and everyone else who will not do such military acts as funding the atrocities do not get to compete internationally with very noncompetitive prices. We have seen many companies complain in the US how they can;'t get access to resources in the US for a competitive overhead. Nor can they get them from US private enterprises. So they just off shore to Communist China. Which I have cited on this website many articles that state that is what the SASAC wished to do. Which was create a resource monopoly bind so everyone had to just offshore to their country. Leaving the world without jobs and the Communist Chinese with the monopoly on rare earth resources.
Along those lines, we have seen the militarized economy of the Communist Chinese use their MSS agents at a mass quantity to constantly use lobbying and IP espionage activities. So the US believes it is a good idea to allow them to take our resource national security issues from us. Even though they have been known to cheat, kill and bribe to maintain a monopoly for theirs. Therefore, we can see how the Russian's who I do not have access to their activities at that time can be analogized to the Communist Chinese. As they both had a similar idea of using the mass to enslave to a single party then use very noncompetitive non individual liberty prices to take the US's business from them so as to weaken our economy and force closure of bases, along with intelligence agencies and create a necessary need to allow the Communist Single Fascist party to come in and control the US's economy via their resource monopoly.
As such, as we have done historically the way out of the deficit and the way to stay competitive in the world market is to start a resource rush. However, unlike gold which is not as expensive as some rare earth resources. We need to create a resource supply that is not necessarily gold but a gold mine. Like we did during Fort Sumter, Alaska and various areas during the cold war. This then could be done via a simple strategy. The strategy could be to allow three mine permits per state. Which could be for rare earth resources. These mines could be smaller mines around a quarter mile each and producing around 66 million a mine. Therefore, we would see a major influx of US jobs and economy as the US companies ownership of mines should that we have minerals for companies to create good paying jobs. Thus then allowing for a proper root style economic rebuild naturally through economics instead of forced through a stimulus. That will just fall through as our high number of business keep defecting each year to Communist China's resource monopoly.
Rider I
http://rideriantieconomicwarfaretrisiii.blogspot.com/
Competition builds more markets while monopolization destroy's markets. Rider I 2011
/ii\
I think the Constant violation of the Communist Party of China deserves sanctions for arming Qaddafi when fighting against UN troops as:
US seeks more from China on Libya arms
I believe there is a Communist Secretary in every business and entity in Communist China. "The United States indicated Wednesday it is not satisfied with China's explanation of a meeting in July between Chinese weapons makers and representatives of Libyan dictator Moammar Gadhafi seeking to buy arms in violation of U.N. sanctions." Let's see the Communist Party violates UN treaties with regards to Iran, North Korea, Al Queada, Hamas, then specifically sell's weapons via a Party secretary entity of the Communist Party which is in every SOE watching over them and speaking to the party on first hand of business. Along with allowing nuclear material in areas of how terrorism like Pakistan and Iran. I think we should sanction them. Along with that they violate UN treaties with regards to funding and protecting genocidal dictators. The worst part is they just do it to get cheap resource contracts that nobody else can get. Along with that they sent a Communist disciplinary member to meet with Poland instead of a Diplomat, which the German Socialist Party did and So did the Soviet Empire.
/ii\
Like imaginative thinking ...
... but I'm not up on Druids as an influence in economic theory or policy. Especially not in connection with Fort Sumter. But who knows what was down there in the catacombs? Like the possibly missing precious metals in a depository of one of the Twin Towers ... plenty of room for speculation ...
I like this thinking. It reminds me of the ideas of that remarkable convergence of some factions of Green Party and Libertarian Party back about 20 years ago.
Also, resources are strangely too often under-appreciated in economics. Like, I guess, there's some kind of grand market-intelligence theory that has already discounted all the fundamentals?
About China, I agree that we must first and foremost clean up our own house. Then we can take on China as a most worthy adversary.
Uncomfortable truth