
The December to January unemployment statistics are often reported wrong in the press. We're sorry, god love ya, but these articles are plain incorrect. People like to compare the month to month change in population, the number of people no longer considered part of the labor force and other data. The grave mistake made by so many in the press and elsewhere is not realizing annual population adjustments* are placed in the January data, not distributed evenly across the entire year, or backwards applied and that's why one cannot compare these two months. Below is a graph of non-institutional population monthly change. This is the number from where all other unemployment statistics are derived. It represents people 16 and older, not locked up somewhere, in a medical facility or in the military.
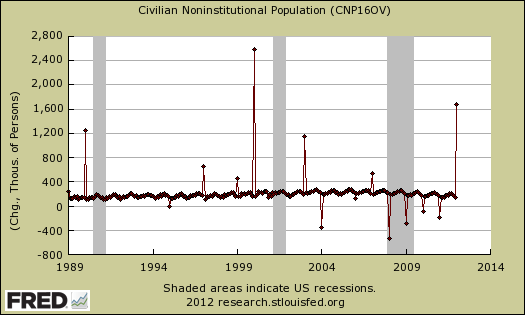
See those huge three spikes in the above graph? That's when the latest Census, taken every 10 years, has been incorporated into the data series. What happens is almost a do over, starting with the next year and you see a huge discontinuity in the data when the Census has been incorporated into the non-institutional population statistic. Believe me, we did not get a streaming horde of illegal aliens in one month, nor did everyone decide to give spontaneous birth. Those spikes simply represent the tacking on of population controls to reflect the latest Census.
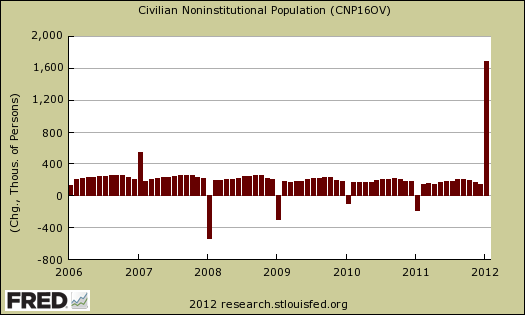
Above is a close up to show the spike in non-institutional civilian population. See how even the monthly change is except between December and January? That's where the yearly population adjustments* are placed in the data series. The adjustments are literally just plopped into the month of January and this is why it is statistically invalid to compare December to January monthly changes. You simply cannot compare a change of a month, when one of those month's includes a year of population adjustments.
To wit, is the current unemployment rate of 8.3% valid? Well, if you like the definitions used by the BLS, it is statistically consistent. Did 1.25 million drop out of the labor force all of a sudden? No, this has everything to do with the Census population levels. Basically there are more people and like many population numbers increasing by proportion with the Census 2010, so did the number of people not in the labor force.
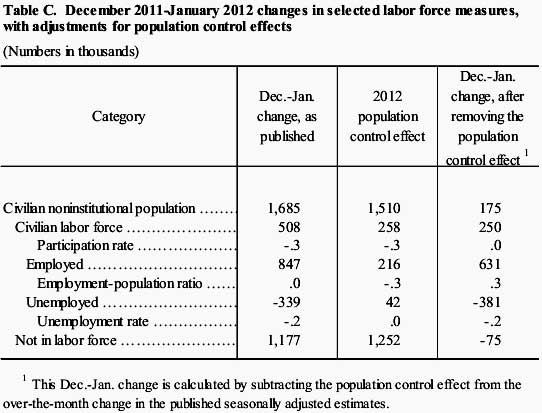
The above is my favorite yearly confusing table from the BLS. This table gives you what the monthly comparisons would be from December to January without the population adjustments. Few read it. Fewer still understand it. Column 1 of table C. is what is reported to you in the press. Column 2 are the population adjustments, put into the January data. The 2012 population controls effect of column 2 is that one lump dump of monthly data which represents a year's worth of adjustments. This time the second column also represents the 2010 Census data incorporated. Ok, now, the last column, column 3. That tells you what the monthly change would be if there were no population adjustments or the 2010 Census was not incorporated into the January numbers.
As you can see, the number of official unemployed would have dropped dramatically, -381,000, the number of employed would have skyrocketed, 631,000 and the number of people who are part of the non-institutional civilian population, but not in the labor force would have dropped by -75,000.
So why isn't the last column used as the official monthly changes? Because this data isn't valid either. You can only go so long without adjusting population growth to actual survey's gathered out in the field without running amok in your numbers and proportions, ratios.
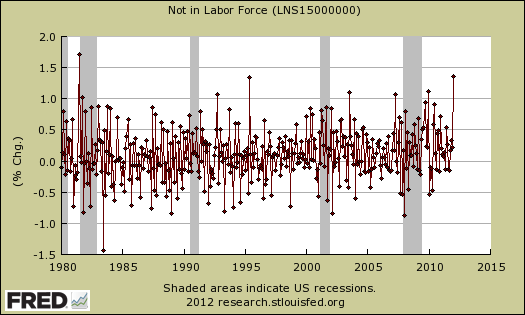
It's true, the not in the labor force monthly increase was a shocker. But if one look at the monthly change, represented by percentages in the graph above, we've actually seen worse. Not in the labor force clearly has people not counted who want a job. It is too statistically noisy to be otherwise.
Here is the BLS explanation on the population adjustments, which so many fundamentally question.
The adjustment increased the estimated size of the civilian noninstitutional population in December by 1,510,000, the civilian labor force by 258,000, employment by 216,000, unemployment by 42,000, and persons not in the labor force by 1,252,000. Although the total unemployment rate was unaffected, the labor force participation rate and the employment-population ratio we re each reduced by 0.3 percentage point. This was because the population increase was primarily among persons 55 and older and, to a lesser degree, persons 16 to 24 years of age. Both these age groups have lower levels of labor force participation than the general population.
Remember, these adjustments represent a decade of change, and the last of the baby boomers are now 50. Yet, we'll be drilling down in the data on this dramatic change, for how many over the age of 55 need to work and are simply being discriminated against?
According to the BLS, of the population adjustment of 1.510 million added to the January non-institutional civilian population, 1.288 million were over the age of 55. Of those, 723,000, or 56%, were not in the labor force. Then, of people ages 16-19, their population adjustment was 430,000 and 327,000, or 76% of them were not in the labor force. To make matters more bizarre, the adjustment to the population assumed to be in their prime earning years, 25-54, dropped by -299,000 in the population adjustments.
Could an additional 1.288 million people over the course of a decade be added to the retirement gang, the 2000 Census off by that many? Yes. Regardless, we'll crank and drill down in those numbers in another post. Stay tuned.
Popular articles which are plain incorrect are listed below.
- ZeroHedge. We're sorry, 1.2 million people did not suddenly drop out of the labor force.
- CNBC, same reason as ZeroHedge.
- Human Events. Gotta watch those population controls.
- Washington Times, ibid.
- Us, unfortunately. No, one cannot claim 1.75 million dropped out of the labor force, especially when one doesn't explain how one pulled that number out of the air.
* The annual population adjustments are based on the last Census results, taken every 10 years, with additional adjustments from birth/death models, migration models are then incorporated to adjust for the total annual benchmark adjustment. To read more about Census Intercensal methodologies, click here.
Comments
Could it be possible for you
Could it be possible for you to explain(succinctly) why the number 1.2 mil dropping out of the workforce is inaccutate. Your description has the "flare" of dazzling with Bullshit
I just did but just 4 u
The civilian non-institutional population was adjusted by an additional 1.510 million. Do you think, magically, the population of the United States, with a total population of 312,959,348, and the non-institutional population being 242,269,000, could magically increased by 1.510 million, in addition to the monthly growth of 175,000?....in a month?
Think about it. There are basically about 3 million immigrants in a year, so no way in just 30 days you could have that kind of population increase. The monthly change in total U.S. population hovers around 200,000 a month. Maybe in China or India monthly population could increase by a million, after all each of those countries has 1.4, 1.6 billion people, but not the U.S. with our population levels. Not unless all women suddenly turned into Octomom.
Or would the size of the population that are not in the labor force, before these population controls and Census data was added, 86.697 million people, also increase by proportion via the 2010 Census adjustments?
The real question is of the adjustments, only 17.1% were entered as part of civilian labor force. *That* is the yet to be answered question, which at the bottom of this article, I say "stay tuned", for we're going to dig into that one further.
But I am clearly stating one cannot claim 1.2 million dropped out of the labor force because you're comparing apples and oranges.
You're comparing two completely different population base numbers upon which everything else is derived and that is not statistically valid.
Yes it's hard to wrap your head around but that doesn't make it B.S. Just because someone whips out a few numbers, graphs and even an equation at you, does not mean they are full of shit, although they might be full of calculator.
Then what is the true unemployment number
Cut to the chase, what is the true number of unemployed people as a percentage of the workforce.
8.3%
Sorry, that's the official unemployment rate. U-6 is 15.1%, no much changed. If you want to calculate the real unemployment rate, read this post, What's the Real Unemployment Rate, and plug in the current numbers. In this new article overviewing some other data from January's employment report, I calculated 17%. That said, these estimates vary depending on assumptions and subgroups included. Point is to pay attention to the data and assumptions used. The real unemployment rate sure ain't 8.3%, not with record duration and people running out of benefits without a job and on and on.
That was my point
I don't believe the 8.3% number either. I'm sure it's much higher. The government is playing with the numbers to make it appear to be better than it truly is. Anyone paying attention can see it's not as good as they say.
So what you're saying is, you can't come up with the true number because there's not enough data provided to do so?
the government is not playing with numbers per say
I know it's popular to blame a bunch of geeky economists and statisticians sitting inside the BLS, but the one's to blame are the politicians and Congress. They control sometimes the definitions and they control the funding to the BLS, which is under the U.S. department of Labor. Nuf said the actual department of labor has been turned into a political hack spot, but the BLS itself is just statistics and numbers. I think you can also blame the Census, but that too, runs into Congress.
I'm saying that the survey sizes need to be expanded to a larger sample set. They need to incorporate social and online surveys, similar to how one makes a purchase via a credit card online so they know it's "you" to get more drilled down raw data.
On population controls, I'm sorry but they really need something beyond a decade survey with hardly any questions on it. A hotly charged topic is immigration status, and I'm sorry but in this day and age of guest workers and illegal immigration, globalization, we need that data. The Demographics used are from the 1960's in my opinion. They need better resolution by occupational categories. They need to capture the under employed.
The USCIS needs to track who is here doing what on various work Visas and other Visas....
They need to breakdown on the payrolls data part-time jobs by hours against full time ones.
But a general "the government is lying to us" just isn't true. This is more a problem of large aggregate statistics, methods and definitions, not some conspiracy.
Absolutely the unemployment rate is higher than the official, but it's always been that way at least since 1996, so by ratios it's still a useful statistic, just gotta know what you're looking at.
Spinning with numbers is so common, it's a sad day when people believe some geeky group like the BLS are doing it on purpose. Nope, it's just math. It's advanced statistics, methods and raw data points, collection methods...
now forcing those can be political. Bottom line this is why Americans need to understand mathematics, statistics. You have to read every number to really separate out the wheat from the shaft here.
For those of you wanting to
For those of you wanting to have Robert "just tell you" the answer as to whether the BLS U3 is or isn't "accurate," he already has provided the best answer possible to that question, and if you had bothered to read the excellent synopsis he provides, you won't get any clearer or better answer anywhere (to the best of my knowledge).
If I took a stab at answering your "just tell us" question, I'd respond by writing that as Robert Oak has already pointed out, the BLS U3 data is accurate only inasmuch as:
1) It is consistent with past months where a decade's worth of revised population based on new census bureau data was suddenly dumped into the total labor pool,
2) It has produced the same type of month-to-month (December to January) wild gyration in a very similar manner as it has three times prior when this census bureau data has been 'dumped' into the BLS computations,
3) The question of whether the BLS U3 January data is "accurate" is the wrong question to ask, given points 2 & 3 above, and the more important point is whether it deviates significantly in terms of December-to-January skewed effect from similar past periods (when 10 years worth of census bureau data gets dumped into and merged, all at once, with one month of BLS U3 statistical analysis; in this case, it appears that it does so deviate.
I hope I read & understood Robert's explanation correctly, and that I was able to at least roughly accurately answer the only question that can be fairly be asked at this point regarding the U3 report for January, to wit, whether it is statistically reliable (rather than whether it accurately reports absolute unemployment levels in the U.S. for the month of January in 2012, which it almost certainly does not).
Robert, please feel free to correct me or clean up any errors I've made in attempting to understand this and break it down.
Thanks
*This is TruthInSunshine, but the system wouldn't accept my response when I tried to use that moniker, so I abbreviated my name in order to get this posted
system hiccup
I should ask ZeroHedge how they block out spam because our system is pretty kludged. You have to respond to the registration email to prove you're a person. I went in an hand approved your account, you're good to go here.
That's right on unemployment rates. The unemployment statistics are ratios, created by subsets of population ratios. So, if one wants to believe only the official unemployed make up the real unemployed and must be part of the BLS definition of civilian labor force, then the rate is 8.2%. I'm thinking of shadowstats, which I think has unemployment around 24% but I cannot find out exactly how he is calculating that so I often don't mention it.
Thanks, Robert. I think I
Thanks, Robert.
I think I caught one my own errors in trying to break down and re-state what you had about the census bureau data.
I stated that "a decade's worth" of census bureau population data gets poured into January, all at once, when in reality, I believe you had actually written that one year's worth of population adjustment data gets poured into the month of January.
For what it's worth, Biderman of TrimTabs states outright that the formula/formulae that the BLS uses in coming up with its "seasonal adjustment" is unknown, so I'm still trying to wrap my head around how it's possible that such an important formula can be proprietary knowledge, if in fact Biderman is correct in that assessment.
Here's an excerpt of Biderman's statement from his article on this subject:
"For those of you who care, look at Table B-1, Total Nonfarm Employment in today’s BLS press release. Start with the non seasonally adjusted table that shows that in November 2011, there were 133.172 million actual jobs. Actual jobs dropped by 220,000 jobs in December and actual jobs dropped an additional 2.7 million in January. Only as a result of unknown seasonal adjustments, could the BLS report 243,000 new hires in January."
As to the issue of Shadowstats, I believe John Williams is currently reporting approximately 23% as U6 (which your readers will understand is the broader measurement of unemployment + underemployment), but I am also unsure as to how he's arriving at that number, as I do not believe even the BLS or Fed Reserve data would produce that high of a % (even though neither formally reports U6 to the best of my knowledge).
Thanks again for your outstanding research and writing, Robert.
TIS
seasonal adjustment is known I think
You can download the software for X-12-ARIMA even. I have it. It's the initial unemployment claims, done weekly, where seasonal adjustments get weird but I think you can even get that version of the seasonal adjustments. Initial unemployment claims are weird because the data lags, comes in slowly from the states plus is a weekly release, vs. monthly and so there is more variance.
But trying to claim seasonal adjustment is some great, huge mystery isn't true.
Check out Chinn, over on Econbrowser. He runs X-12-ARIMA all of the time. Now he's "way up there" in the theoretical clouds sometimes so translating his thoughts to English gets lost but you can indeed, pull down the not seasonally adjusted data, run X-12-ARIMA on it and come up with the matching seasonally adjusted version.
I think this guy is after a red herring if he's trying to claim seasonal adjustments are some grand conspiracy. Hiring is seasonal, jobs are seasonal. Anybody who has tried to land a career position in the last half of December knows this. Anyone trying to land a construction job in January knows this.
What's irksome is how the BLS does not seem to have a statistical approach that's valid to retrofit new annual population adjustments across past months of data. I plain think they need to update their population controls from annual to at least quarterly or something, but that's just me.
Hey, login, you'll bypass all of the CAPTCHA plus registered users can create little "mini blogs" in the comments, links, images, videos.
X-12-Arima - thanks! That's
X-12-Arima - thanks! That's the next go-to source for me in wrapping my head around the latest & greatest from the BLS.
TIS
hey, login
X-12-ARIMA isn't for the faint of heart, it involves some statistical knowledge. It's an auto-regressive moving average if that means anything to anybody.
In English, it smooths out cyclical spikes that are well developed patterns. Case in point, someone is a fisherman or works the fishing docks. There will be a huge hiring spike during say crab season and then a huge spike down when it's over. Seasonal adjustments smooth that out over the course of a year so you don't get those spikes.
The reason they do that is to see the "real change" in levels vs. just seeing "huge spikes" that are simply due to the season every year. By smoothing out those "huge spikes" over time, one can more easily see if there was actual job growth or was it just "fishing season".
Another example which I found very weird. In December, transportation carriers, i.e. UPS, Fed-Ex, DHS etc. added 50,000 jobs in a month. Well, hot damn I thought for sure those would be seasonal, but it appears not this month. I guess UPS, Fed-Ex, DHS etc. just decided to do their permanent hiring right at the start of the holiday season, which in a way makes sense.
Hey, login, you can track your comments and publish immediately, no moderation queue!
seasonal adjusment error
I think also, I kind of did a hack to show if the seasonal adjustments are off and there does seem to be a magic pattern now that January posts "high" payrolls, that wee little bit can overstate payrolls.
That's what I was referring to in this comment here, where I made those difference graphs on seasonal adjustments, payrolls.
Down "spikes" in Population chart?
I’m afraid to ask this because you may have answered it; but this stuff is really thick for me.
I think I understand that the UP “Spicks” are population INCREASES for the year “plopped” into the database in January. But, I don’t understand is the meaning of the DOWN “spikes” in the “Civilian Noninstitutional Population."
Thanks for great analysis
Tom
"down" spikes in chart
First, the charts are not population, but non-institutional civilian population. This is the biggest super-set from where all unemployment statistics are derived. So, that excludes kids, people in the military, people in prison (right, let's ignore prison labor via private prisons), people in hospitals, mental institutions, nursing homes.
Ok, so those huge "upward" spikes are the Census adjustments. It helps to look at the bottom of the graph where the dates are. You can see those three upward "spikes" correlating to the 10 years when the new Census (taken every 10 years) is incorporated into the non-institutional civilian population numbers.
That said, if the Census had shown there were less people in the country than 2000, those spikes could have been the opposite, downward, meaning the U.S. non-institutional population would have shrank.
It did not of course, the U.S. population and non-institutional civilian population has grown since 2000.
Then, those "downward" spikes, are primarily the yearly, or end of year population adjustments. This is done annually. What happens is non-institutional civilian population comes off of the base Census survey. Then, there are additional real world survey data, plus statistical algorithms, to project how much non-institutional civilian population will increase each month.
You have the 10 year Census, then the "interyear" or yearly Census quality controls to population growth estimates. Every year the Census looks at a bunch of stuff, i.e. birth records, death records, inter-state migration, out of the country migration, immigration (now you see why it can be so wrong!), ex-pats and a bunch of other stuff. Then the annual growth of the population and also the "age bracket" groups of population are adjusted.
Once a year the "miss" or error between the projections and the real world data are updated and it's plopped into the January data.
That's what I mean about a year of cumulative error being dumped into just one month's worth of data. This is also why one cannot compare December-January monthly change. You've got a year's worth of cumulative error corrections being added to January.
You might also look at those "downward spikes", which could just as easily be "upward"
as the BLS hitting the "reset button".
It's like to resets the rate of growth of the non-institutional population to real worth current rates.
So basically the Census is the base number from where everything "starts" and then statistical algorithms give the monthly increases for each month, plus there is real world data that comes in which adjusts the statistical algorithm to what's really happening.
This month got a double whammy, the 2010 Census was added plus those yearly adjustments.
If N is non-institutional civilian population and is the monthly growth in non-institutional population and C is the base census, then
  is the current non-institutional population and is adjusted by the Census bureau through the quality controls annually, i.e. those population control adjustments happen once a year and those are the discontinuities or "downward spikes" in the above graphs.


")

Every 10 years:
Every month:
Every year the growth of population is adjusted by quality controls and statistical agorithms:
The civilian non-institutional population is not seasonally adjusted.
Then, as if that's not enough adjustments, there is also a seasonal adjustment algorithm. It's basically X-12-ARIMA but also has to be "recalibrated" using a years worth of data which is one of the reasons you see this "plop" in one month.
But bottom line this wild spikes, up or down are the yearly population controls. They represent a year's worth of error and change, plopped into the January data as a do over.
Whew! I hope that helps, without starting to whip out the real mathematics (up there is just a little concept), I'm running out of words and images, concepts to explain this, although I think a flash video could really help.
I suggest playing around with FRED too, the St. Louis graphing system which is where I made the above graphs. The changing visuals might help with the concept.
down "spikes" thank you
Yes this is a big help. I can't say I fully understand it, but obvious this is a specialized field which one needs training. Most important lesson is that the MSM commentators are clearly 'blowing smoke" when they give their so called 'analysis'.
thanks again. This site is a gem!
Tom
Thanks
Over on the right hand column are mainly government and private reports (that are used by governments) overviews. I started doing these overviews because so many in the MSM plain get them wrong or didn't explain much. Be nice to know if I'm successful in translating them to English for people to understand. Yeah, I'd say once one goes into seasonal adjustment algorithms, it helps to have a statistics course or 5, no doubt about it.
Nicely done
thanks Robert, a good round up. I've got my hands full with the benchmark and NAICS changes http://www.bls.gov/ces/cesbmart.pdf so having your write up on CPS issues is a big help. Will have to add your blog to my daily walk-thru.