The August 2012 BLS unemployment report shows total nonfarm payroll jobs gained were 96,000. Even worse news, the last two months of job gains were revised down. July's gains are now 141,000, revised from 163,000 payroll jobs and June is a now a measly 45,000 jobs, also revised down from 64,000. The August unemployment rate dropped, from 8.3% to 8.1%, but not due to people getting a job, they literally dropped off of the statistical radar. The below graph shows the monthly change in nonfarm payrolls employment.
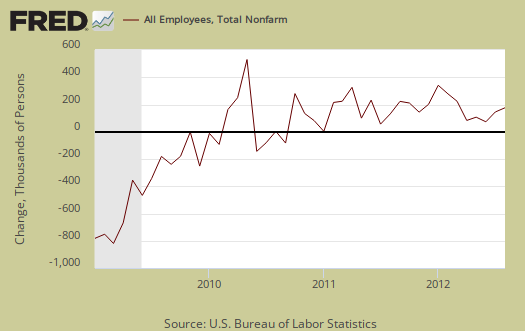
There were 103,000 private sector jobs gained while government payrolls shrank another -7,000. Manufacturing lost 15,000 jobs.
The start of the great recession was declared by the NBER to be December 2007. The United States is now down -4.778 million jobs from December 2007, 4 years and 8 months ago.
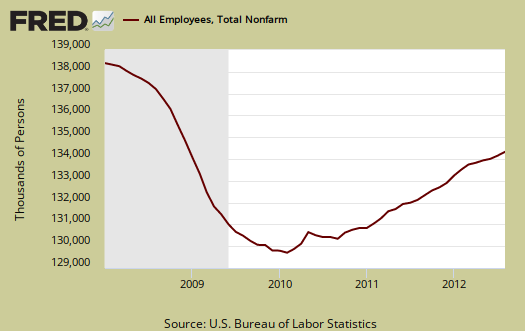
The below graph is a running tally of how many official jobs are permanently lost, from the establishment survey, since the official start of this past recession. Increased population growth, implies the United States needs to create at least 10.6 million jobs or self-employment, using the population survey statistics. This estimate assume a 62.7% civilian non-institutional population to employment ratio, as it was in December 2007. This implies an additional 5.84 million jobs were needed over a 56 month time period beyond the ones already lost. This is just taking into account increased population against the payroll jobs gap, the actual number of jobs needed is much higher, in part because payrolls or CES, and population, i.e. CPS, are two separate employment surveys from the BLS.

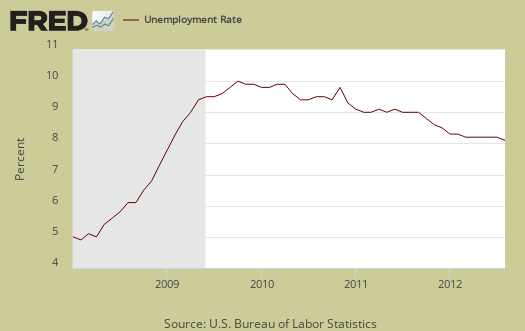
The official unemployment rate dropped from 8.3% to 8.1% with 12,544,000 officially unemployed.
U-6 is a broader measure of unemployment and includes the official unemployed, people stuck in part-time jobs and a subgroup not counted in the labor force but are available for work and looked in the last 12 months. Believe this or not, U-6 still leaves out some people wanting a job who are not considered part of the labor force. U-6 dropped from 15.0% to 14.7%.

The labor participation rate, dropped from 63.7% to 63.5%. If we go back to December 2007, the labor participation rate was 66%. The highest civilian labor participation rate was in January 2000, at 67.3%. What a low labor participation rate means is there are over 6.1 million people not be accounted for in the official unemployment rate, in other words counted as employed or unemployed, many who probably need a job and can't find one, in comparison to 2007. That's in addition to the official 12.544 million unemployed.

The employment to population ratio dropped -0.1 percentage points to 58.3%. In January 2008 the employment to population ratio was 62.9%. You have to go back to the severe recession of 1983, October to find such low ratios, but in the 1983 case, the low ratios were short lived, unlike the past few years.
The low employment to population ratios clearly show people dropping out of the labor count. We can see this by the cliff dive employment to population ratio during 2008-2010. There is no way magically, suddenly, a huge increase of population volunteered to drop out of the labor force, turned 65 at once, or magically all went to school. These are mostly people plain out of a job. The cliff dive in employment to population ratio represents about 11.2 million people, which is around the same amount of jobs really needed to keep up with population growth calculated above using payrolls.
The official unemployment rate is a ratio, a percentage during a limited time period to calculate the number of people actively looking for a job and counted. Many people are not counted in the official unemployment statistics. Truth is America has more potential workers and less jobs in this so called recovery than any other period past the Great Depression.

How did the U.S. add only 96,000 jobs yet the unemployment rate actually decreased? The BLS employment report is actually two separate surveys. The jobs number comes from the CES, or establishment survey where the unemployment ratios comes from a different survey, the CPS, otherwise known as the household survey. The unemployment rate is a ratio of those officially unemployed to those officially counted as part of the labor force and comes from the CPS. In the below graph are the monthly change in unemployed from the household survey.
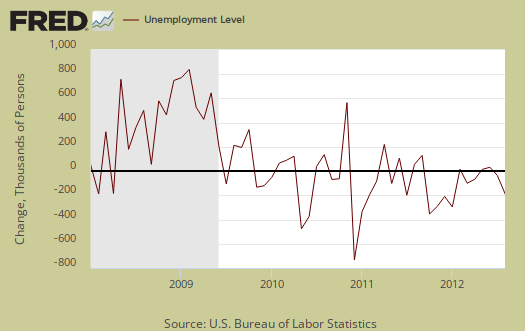
Less people were considered part of the labor force in August. Those not in the labor force increased by 581,000 while the overall non-institutional population rose by 212,000.
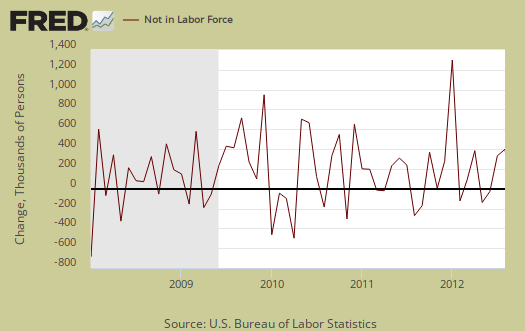
The civilian labor force decreased by -368,000, whereas those officially unemployed dropped by -250,000. Below is a graph of the never ending volatile and often shrinking labor force.

Yet those officially employed also decreased by -119,000. In other words, the payrolls survey, CES, says jobs increased while the population survey, CPS, says jobs actually decreased. The population survey also shows a huge number of people dropped out of the labor force. In other words, by the CPS, we actually lost jobs for the month yet the people dropping off of the official count of unemployed was so massive, it reduced the official unemployed statistics.
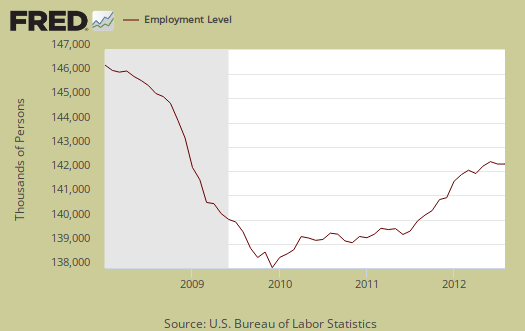
There are differences between payrolls and employment levels from the CPS. Payrolls counts employer jobs whereas the population survey also counts the self-employed, unpaid family workers, agricultural workers, and private household workers. That said, the margin of error for the CES is 100,000 whereas the CPS has a 400,000 margin of error on the payrolls and employed statistics respectively. Going off of the monthly changes of the CPS survey is statistically risky. The monthly changes are highly noisy and the CES, or payrolls survey is deemed more accurate and stable.
That said, this is simply a horrific report, we need around 100,000 payroll jobs each month just to keep up with population and today's figures, along with the revisions show that's not happening.
For more information on how the BLS tabulates non-farm payroll jobs, see this article, Under the Hood of the Employment report.
Here is last month's overview, only some graphs revised.

In one word - horrific; in two words, f***ing horrific
This is as bad as it gets. There is no spin in a non-political world that can make this acceptable. Add this to the fact that millions of people literally cheer both candidates that have created this nightmare and we're screwed because they like blue and MSNBC is better, no, red is better and Fox News is awesome. No one at the top's responsible except when it comes to collecting votes and mega-paychecks, then they do it all.
We've seen the articles and reports here and elsewhere that 1/10 long-term unemployed EVER find a job. Are the unemployed and struggling Americans just supposed to die and vanish because I have yet to hear one word pissed off about that fact by anyone in power (1 in 10 EVER finds a job again, what?!). I know EP says 100,00 too keep up with population growth, I've read elsewhere at least 150,000. Anyway you slice it, nowhere near growth we need to cut unemployment without waiting 20 years (how many people die in the meantime from lost medical care, homelessness, strokes, stress induced heart attacks)? Nightmare! And the jobs we do get no one can retire on or support anyone on. Yes, cheering for both candidates because they speak in generalities that no one with a clue buys. We're screwed.
worse and worser
Our real problem is we continually get policies, bills demanded by lobbyists instead of policy, legislation putting the U.S. worker first and foremost in priority.
While the DNC convention had celebrities, awesome performers and soaring rhetorical speeches, the reality is Bill Clinton enacted a host of bills which royally screwed the U.S. worker. NAFTA, China PNTR, Gramm-Leach-Bliley Act, Commodity Futures Modernization Act to name a few.
Of course the GOP will never point that out because they love all of those bills and like even worse agendas which screw the U.S. worker.
The DNC convention looked like the "illegal alien convention". The reality is the U.S. simply does not need even more workers, there just isn't the demand and we need to employ the millions of Americans already here (and legal) who need a job. Instead of facing labor economic reality, we get B.S. and bogus spin trying to claim immigration increases jobs. It's pure bunk and that's from a historical statistical reality check. The economic fiction spun on immigration is like a blizzard of lie snow.
Just disgusting to see them claim they are for the middle class when they continually promote illegal immigrants, or more immigration instead of the U.S. worker. Immigration is simply not the U.S. middle class. When it comes to the people already citizens of the nation, they might as well say go screw yourself.
All of this aside, with the GOP one can guarantee we'll lose even more jobs with their agenda and policies. Talk about fiction, they are living on planet Zereton, completely out in the economic clueless cold and theoretical wilderness where nonsensical mathematics goes to sprout.
Grover Norquist should be tarred and feathered and run out of town on a rail. I have no Earthly idea how that guy has so much power, build on a garbage mountain of fiction and lies where he sits on his throne.
Infrastructure, direct jobs, a requirement those jobs go to U.S. citizens only is one good policy, but the problem is this administration won't make jobs conditional on citizenship or buy America provisions. We get all sorts of bull from some various clauses on treaties previously signed and my attitude towards that is to repeal them. They think China worries about their domestic sourcing provisions on the global stage, or even Canada? Hell no. I know they can enforce U.S. citizenship for those jobs though. So many DoD jobs require citizenship due to security, so there is no reason they cannot.
I was watching the blacks at the DNC convention, thrilled over their candidate, overjoyed, clearly going to come out in full force to vote him back in office. I was shaking my head, thinking about how they lost all of their economic gains since 1965 while Obama has been in office. Boy, some help they got back for all of that support, is what I was thinking. Bottom line, infrastructure jobs, by requiring U.S. citizenship, could really help the black community, they are the #1 group, based on ethnicity categories from the BLS, who really need some GODDAMN jobs!
It's hard to say we aren't headed towards Third World status
If you look at the complete economic destruction that's been going on inside the US, it really does look like we are now approaching Third World status. What modern nation can really have people paying $100,000 so that they can join 22% of their fellow citizens unemployed while their government shows it doesn't care about its own citizens and merely serves wealthy domestic and foreign interests? That's the very definition of a banana republic and oligarchy. And given the complete destruction of the rule of law, we are surely at banana republic status. What democratic nation actually allows people to incorporate and then break laws regarding price fixing commodities and interest rates, commit forgeries 10,000+ times, bribe officials, bankrupt towns and counties, illegally foreclose on veterans, commingle and steal billions of dollars, etc., etc. and then escape any justice because they pay for political campaigns and lobby law enforcement and regulators? Doesn't that sound like a banana republic? Or hack thousands of phones, bribe police internationally, compromise child murder investigations, but never get arrested and actually run a US-based media corporation, lobby law enforcement, and actually dictate America's immigration policy? Or view money launderers and terrorist financiers more highly than US citizens because those with the money dictate policies and enjoy a two-tiered legal system? Surely this is a banana republic.
One need only see how people who apparently don't understand supply and demand and labor economics (or are obviously lying about it to get more $ and political power) argue more free trade and unlimited immigration will create jobs? Bloomberg must've missed Econ. 101 despite his business "acumen." In what world could that happen? Even Alice in Wonderland makes more sense then that "logic." Maybe in a world where gravity means things float up and Newton's laws of physics are nonsense but talking points are gospel?
And for those who think this is madness and people who say these words are idiots who have never traveled the world or are Communists or Fascists or some other trite turn-of-phrase, read our postings, our analysis, on the countless blogs out there in 2012. Here and on other sites, do the people who say these words come off as unintelligent, poorly educated, or not well-traveled? Or do the people who spout the endless left vs. right, Dem vs. Republican, freemarket vs. Communism tripe actually sound more ridiculous in the face of facts, facts, and endless facts from around the world?
My candidate says Americans are lazy, I'm not lazy, but he says I am, so he must be right! People should work for free as interns to show their bosses they should pay them?! Karzai is good, he is rich despite being a "public servant" that oversees a heroin empire, but my candidate says he's good, so more $ to him at my fellow citizens' expense and let's keep defending his life and power! My candidate takes money from Goldman Sachs, and so does the other candidate, but my candidate says he's looking out for me and not bankers, so I trust him!
Anyway, the Founding Fathers are rolling over in their graves, and if there is a zombie apocalypse, I hope to God they rise up and have an all-you-can-eat buffet in corporate boardrooms and political halls of power. Sure, the brains won't be nourishing and are in all likelihood very diseased, but it's a start. Let Jefferson and Paine and Franklin feast and make our world a brighter place. When there's a lobbying group listed as a top donor to either candidate that represents the 99%, the long-term unemployed, the outsourced STEM grads and workers, recent grads that could cure AIDS but are now waiting tables or working as interns so teleprompter readers can call them lazy and uneducated, let us know. The rule of law is dead. Spin is endless. And Burundi's or Pakistan's legal system will soon seem more fair to the 99% than our own. This system was paid for by the corrupt and is perpetuated by them. We are locked out. Bring on the zombie Founding Fathers!
number of jobs needed to keep up with population
Didn't answer that before, I actually calculate out how many per month, one can do this based on the monthly statistics and will be writing up another article on other parts of the report.
The press quoting "150k" are just aping something else they read one day. I know most do not run the numbers themselves, although a few clearly do. Honestly, so many get these reports wrong, dead ass wrong, and that was the motivation to start writing overviews in the first place. It is just ridiculous as if the press cannot do high school math and the government does make a huge amount of data available to the public, as they should, at least on the Federal level.
Anyway, more is coming and yes, we are becoming a 3rd world nation, we have such income inequality the macro level statistics hide the reality of the median, which is why I do things like graph up actual wages by brackets from gov. data and so on, to show most of America is dead ass broke, in poverty, can barely keep a roof over their heads and many plain can't. Who can afford $800/mon rent when they are making $26k a year, even that's a real stretch. Places like California, New York, DC if you find $800/mon you're living with rats and cockroaches.
Net job status from New Unemployment Claims verses Jobs data: va
I have an naive question. If I look at the U.S. Department of Labor 4-Week Moving Average of Initial Claims I see the following numbers for July and August (randomly chosen example months):
2012-07-07 377,000
2012-07-14 376,000
2012-07-21 368,250
2012-07-28 366,250 or 1,487,500 total new claims in July
2012-08-04 369,250
2012-08-11 364,500
2012-08-18 368,750
2012-08-25 371,000 or 1,473,500 total new claims in August
There was a net decrease in new claims from July to August of 14,000 fewer claims.
The BLS Employment data showing net changes is jobs per month says that July was up 141,000 (preliminary) jobs over June and August was up 96,000 (preliminary) jobs over July.
How does one reconcile jobless claims versus employment change? I would roughly equate new claims for unemployment with jobs lost. Using that definition, we lost something on the order of 1.5 million jobs in August. If we simultaneously added 96,000 new jobs, is it correct to say that we had a difference of 1,473,500 lost minus 96,000 gained, or a net loss of 1,377,500 jobs overall?
Using this approach since 2008 we had 110,233,250 new unemployment claims/jobs lost versus 4,359,000 jobs added (months of negative growth were ignored, since those losses would likely be reflected in unemployment claims).
The end result is a net loss of jobs 105,874,250 over the last four years. Where does my reasoning break down?
Confused
churn & ratios & filings are not benefits, payrolls, jobs net
Payrolls, employed levels are net, not gross. In other words, people lose jobs every day and every day jobs are gained. The BLS employment report is giving you the net monthly amount: (jobs gained - jobs lost). Jobs disappear, new ones are created that never existed before.
There is churn in employment, in other words, people lose jobs but get new ones so fast they never show up in the monthly numbers. So, while monthly initial claims may add up to 1.5 million, there is a large percentage of those initial claims will get jobs or will be denied unemployment in the first place.
Filings are simply filings, not benefits approval and the requirement to get UI is pretty ridiculous. Filings are people who filed asking for benefits. Employers these days try to deny benefits because they eventually will pay more in UI contributions so they lie and claim people were fired for good cause, which denies people benefits.
Anyway, it's not a simple addition of initial claims to get a correlation to jobs at all. Some of those people will have a new job tomorrow, some will be denied, some will stay on the UI rolls and some will run out of benefits and never get a job.
I wrote up an article earlier, initial claims and correlation to payrolls, where I show there is a correlation to jobs but it's not a direct just "add up" the numbers due to employee churn and hires, addition and subtraction. At best you have a scalar multiplier, this is a constant, like pi or e.
(that's a math joke but getting a jobs these days seems to be the result of the magic of the karmic universe)!
I actually show those as scalars in the above link. i.e.. 400k means blood letting stopped, 365k initial claims implies more job growth than population growth, but those are rough numbers. You have time in here, a time variable as well.
Scalar is constant, so a ratio, such as 1 in 7 or 1/4th, just a math definition in case no one is familiar with it. Means "stuck thumb in air, wet it, and gauged how hard the wind is blowing" and plenty of those types of scalars in economics.
Change in employment and jobs lost in the numbers
Conclusion: the labor force is so large (about 110,000,000) that a change of a few hundred thousand is lost, and cannot be accurately estimated. If so, monthly changes are meaningless.
monthly employment margins of error
If you read the overview, every month we mention the margin of error, for CES is 100,000 for CPS it's 400,000. Most months the jobs reported gained are within or around the margin of error and it's better to look at the 6 month gains, which have revisions.
We do the monthly because people want more accuracy and up to date statistics, and this is where we have said complain to Congress to fund more to the BLS and enable better, more complete surveys via the Census as well as the BLS.
Our crazy Congress instead is trying to silence the BLS and the Census, even LESS statistics when we need way more.
Lower wages
Many of the jobs are now, and have been for several years, lower wage jobs. Job listings in my area show wages 20% or more lower than what the same job paid pre-crash.
And people are happy to have the low wage jobs vs no job at all.
In addition many retail jobs are very part time. This means no benefits.
So we have more unemployed, fewer jobs with benefits and low wages for existing jobs. Not a good future.
Conflict between BLS and ADP employment reports
The BLS August 2012 report shows 96000 jobs gained, but the ADP report shows 201000. Most of the time, the BLS total is somewhat higher (includes government workers) when the trend is up (lower when the trend is down). But in August, the difference was so large, and the trend from prior months was in the opposite direction. Can we rely on either of these reports?
For August, BLS is pessimistic. ADP is optimistic.
Any response?
ADP vs. BLS, in the overview, see the graphs
In the graphs we show trends and differences between the two and point out they never match but the slope, overall is similar. I think you're missing the other articles on the site. Here is the ADP employment report overview, complete with BLS comparison charts.