
The U.S. international transactions release is an odd duck. The current account is kind of like an economic income statement of the U.S. vs. the rest of the world. The current account deficit was $117.4 billion for Q2 2012, a 12.1% decline from Q1's current account deficit of $133.6 billion.
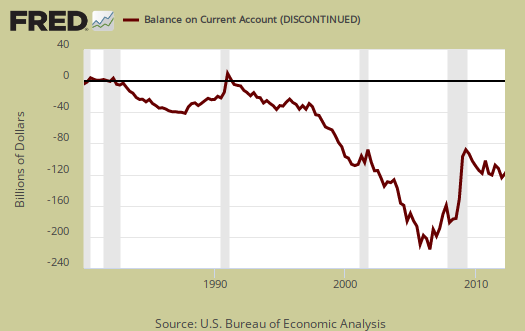
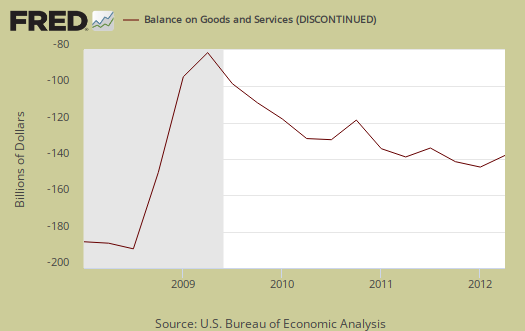
The current account is the net trade of goods and services plus net income global flows and net transfers. The primary reason for the current account deficit decline was less oil imports and more soybeans exports in the goods trade component of the current account. Soybean exports jumped $2.832 billion from Q1. Petroleum product imports dropped $8.023 billion.
The current account includes the trade deficit, income for resident and foreign business entities, people, and something called net unilateral current transfers and it's current transactions, meaning what's happening now, or current production.
Unilateral current transfers is a fancy way of saying money given as aid, charity, plain sent home from foreigners in the U.S. as well as U.S. grants and retirement pensions. Income is 99% money earned on U.S. owned assets vs. money paid to foreign owned assets that are in the U.S. The rest of income is payments and receipts to temporary employees.
The surplus on income increased to $55.5 billion in the second quarter from $47.4 billion in the first.
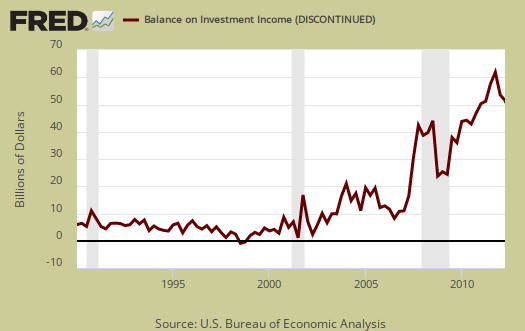
The above blow up on net income shows just how much U.S. investment originally went abroad. Here is the definition of investment income:
Income on U.S. direct investment abroad and foreign direct investment in the United States consists of earnings and interest received from, and paid to, businesses where there is 10 percent or more ownership by the parent of the voting shares of the affiliate.
While the focus is often on the goods and services trade deficit, the current account broader measure shows how free flows of capital are busy making profits while we get our jobs offshore outsourced.
One of the weirder definitions to parse through for international transaction is the definition of a U.S. resident. That's not people, but entities, unless of course you believe corporations are people as our legal system does.
A U.S. resident is defined to include:
- Individuals residing permanently in the United States
- Business enterprises and nonprofit organizations established under U.S. laws, including corporations, partnerships, and proprietorships
- U.S. federal, state, and local governments, together with their subdivisions.
Now check this out, all of those foreign guest workers on Visas which last more than a year, are counted as U.S. residents.
Individuals who reside or expect to reside in the United States for 1 year or more are considered U.S. residents. An exception is made for U.S. students who study abroad and foreign students who study in the United States; students retain the residency of their home country regardless of their length of stay. U.S. government employees stationed abroad (and their families) such as diplomats, consular officials, and members of the armed forces are also considered as U.S. residents, regardless of their length of stay abroad. Affiliates of multinational corporations are considered as residents of the country in which they are located, not as residents of the country of the parent; thus, U.S. affiliates of foreign corporations are considered U.S. residents, and foreign affiliates of U.S. corporations are considered foreign residents.
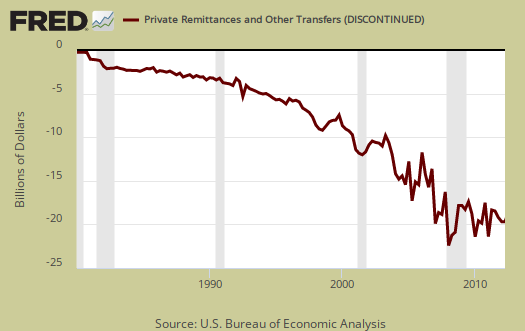
One of the things not mentioned much are remittances. Remittances are money sent outside the country by foreigners living in the United States. Think Western Union to Mexico and wire transfers to India. Below is a graph of how much money is flowing back to home countries.
Net unilateral current transfers to foreigners were $33.6 billion in the second quarter, up from $32.7 billion in the first. The increase was more than accounted for by an increase in the category of private remittances and other transfers.
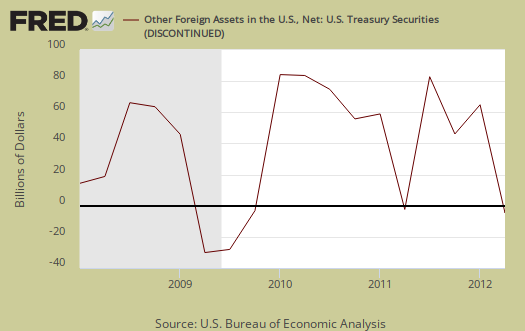
U.S. net treasury holdings also was way down for Q2.
Foreign private purchases of U.S. Treasury securities exceeded sales by $7.4 billion in the second quarter, slowing from net purchases of $43.8 billion in the first.
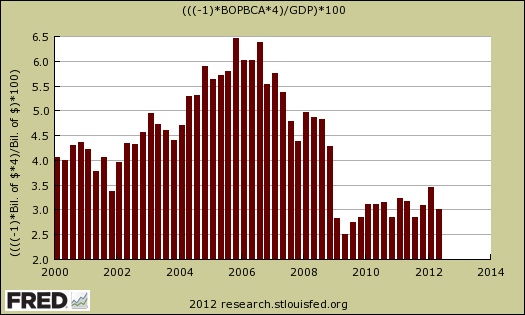
There is more to the current account deficit than just a negative balance sheet. The implications are that country must borrow from abroad, or sell off domestic assets to make up for the current account in the red amount. The current account deficit as a percentage of Q2 GDP was 3.0%, down from 3.5% in Q1. That's actually good news, but don't expect it to last. The trade deficit has increased since Q2 and global slowdowns do mean less exports. Below is a graph of the current account deficit as a percentage of GDP, by quarters going back to 2000.
Beyond the top link of this article, which goes to the statistical release, we found this BEA guide very useful in explaining concepts. The missing table data for the report is located here.
this is a new overview
We haven't covered this economic release until now. We hope to look at finance and capital flowing around the globe in more detail, starting with this overview.
love the last chart
Great data and charts as usual.
I especially like the last chart showing the trade deficit as % of GDP. That comes in handing for the sectoral balances equation:
Federal Deficit = Net Private Savings + Trade Deficit
BOPBCA. is current account, current account as % GDP
Not the trade deficit, it's the current account deficit as percentage of GDP. Sorry, the FRED system doesn't let me change graph titling and FRED is so much faster to create graphs with. Just a FYI, probably what you meant.
So the equation at the top of the FRED graph is:
Current account = BOPBCA
Then, I am annualizing the current account deficit (per quarter, so times 4) and then I am inverting the value so we have positive percentages. Nominal GDP in the BEA tables and in FRED is presented annualized on the quarterly, so to match, that's de formula, in case anybody else is reading along at home.
Yeah, for simple calculations nothing better than the FRED system, well, nothing better than the FRED system period, except for the missing data series. The FRED system, one cannot change the graph titling, so I drew out the mathematics a tad but I guess I didn't explain the symbol for current account deficit.
I see you commenting here and we invite other authors, cross posts, as well as requests. I think I've mentioned sectoral balance during some sort of delving into multipliers back during the infamous Moody's multiplier sheet for "Stimulus", but haven't touched the topic at all. On this site, I try, although I'm not so sure how successful, to make equations and theory understandable by those who never touched the cover of an economics textbook, so people who know how to explain, I'd love to find more folks to author.
There is usually some horror show to write about too, every day another outrage du jour, often built on lobbyist white papers lies and fictional stats., but that said, this site even has LaTex available.
I'd love to find others willing to write up easy to understand tutorials for those with basic math, to show, in layman's terms, what each variable means but don't skimp on the equations either.
I think the best defense against lobbyist snow and statistical spin is knowledge and if this stuff is explained well enough, with enough color, in plain English, just skip the entire Academia lingo and language, more people will see they are in a lobbyist minefield of bullshit when it comes to the economy and what should really happen, by policy.