
August 2013 Retail Sales increased by 0.2% on auto sales, which increased 0.9% from last month. Motor vehicle dealers are having a good year. Their sales have increased 12.3% from a year ago. Without motor vehicles & parts sales, August retail sales would have been a 0.1% increase from last month. Building materials and clothing dragged retail sales down as they declined -0.9% and -0.8% respectively. July retail sales were revised up by 0.2 percentage points to a 0.4% monthly increase. Retail sales are reported by dollars, not by volume with price changes removed.
Retail trade sales are retail sales minus food and beverage services. Retail trade sales includes gas, and is up 0.2% for the month and has increased 4.8% from last year.
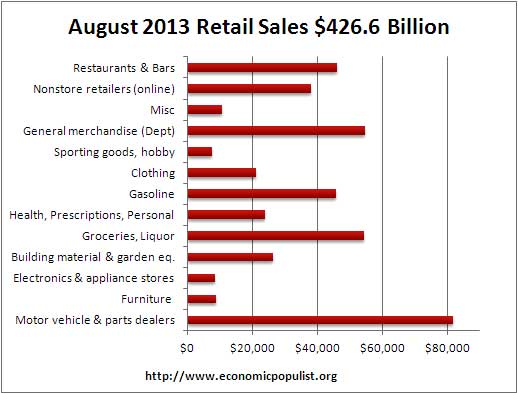
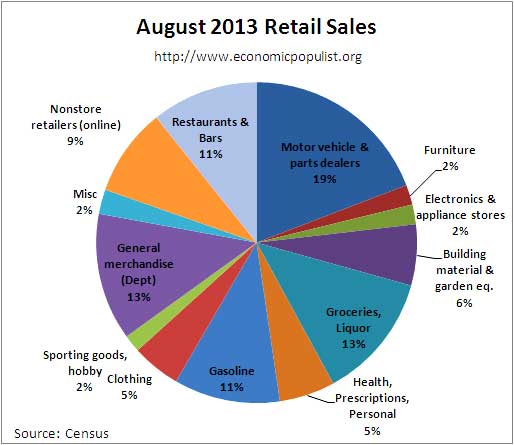
Total retail sales are $426.6 billion for August. Below are the retail sales categories monthly percentage changes. These numbers are seasonally adjusted. General Merchandise includes super centers, Costco and so on. Online shopping making increasing gains, increasingly important in overall retail sales. Online shopping continues to expand as nonstore retail sales have increased 10.2% from last year.
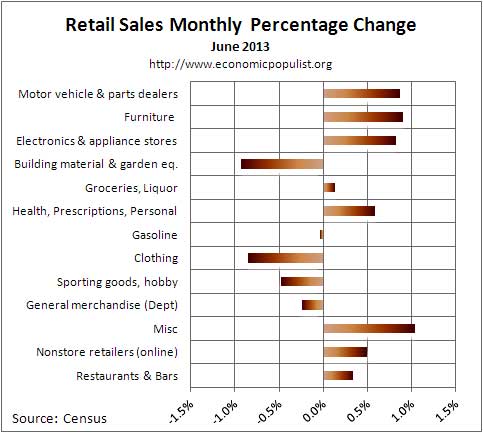
A surprise, gasoline station sales have declined -1.5% from one year ago. Sporting goods, hobbies, books & music sales have increased 3.4% from last year.   Motor vehicles & parts sales overall have increased 10.9% from last year, which implies parts by themselves are less. The ones that are hurting are Departments stores. Their retail sales are down -5.3% from August 2012 with general merchandise stores, where department stores are a subcategory, have declined -0.3% from a year ago. Building materials, garden sales, which are large by volume, have increased 7.6% from a year ago. Grocery stores have increased sales by 2.9% from this time last year. Below are the August retail sales categories by dollar amounts. As we can see, autos rule when it comes to retail sales.   We also see that electronics, which are up 3.1% from a year ago, is much smaller by total dollars than motor vehicle sales. This implies there is a hell of a lot of hype around smart phone sales in terms of the overall economy. Amazing how Apple can use the press instead of pay for advertising to hype their products, quite a shocking market trick, but in terms of the U.S. economy, a drop in the bucket.
Graphed below are weekly regular gasoline prices, so one can see what happened to gas prices in August. Gas was $3.574/gal. in August and we can see it was flat, which explains the flat sales for gasoline stations and the annual decrease.

The below pie chart breaks down the monthly seasonally adjusted retail sales by category as a percentage of total August sales by dollar amounts. One can see how dependent monthly retail sales are on auto sales by this pie chart. We also see non-traditional retailers making strong grounds on traditional general merchandise stores.
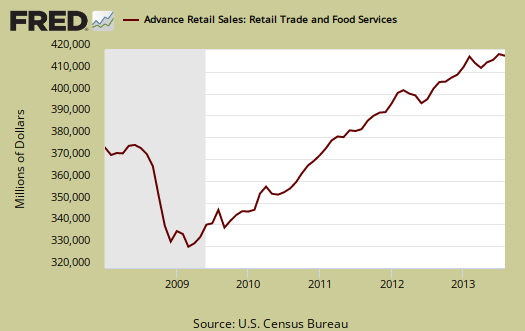
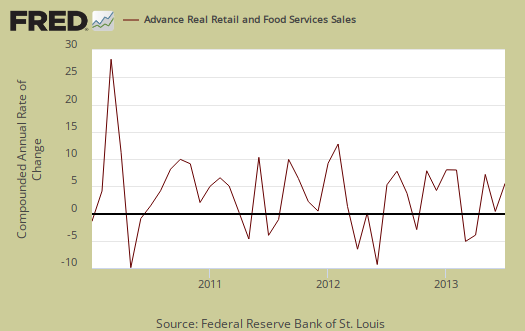
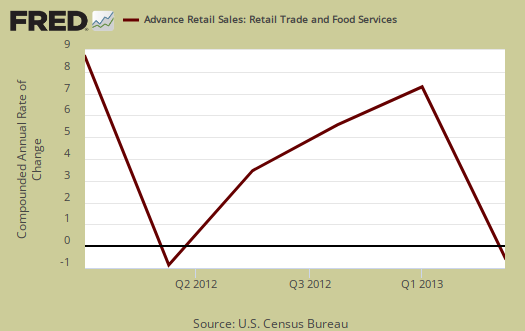
Retail sales correlates to personal consumption, which in turn is about 70% of GDP growth. Yet GDP has inflation removed from it's numbers. This is why Wall Street jumps on these retail sales figures. Below is the graph of retail sales in real dollars, or adjusted for inflation, so one gets a sense of volume versus price increases. Below is the annualized monthly percentage change in real retail sales, monthly, up to July 2013. While some in the press are claiming retail sales implies poor consumer spending, it looks like slightly higher consumer spending than Q2 for now, although to really estimate PCE we need the actual monthly statistics.
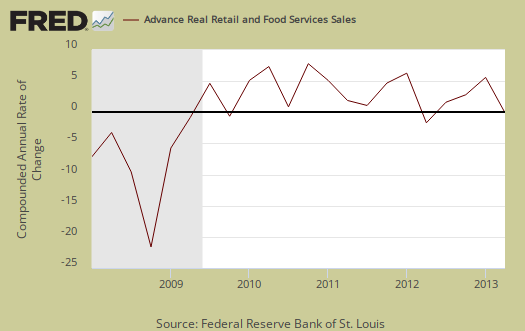
To obtain real values, retail sales are deflated using CPI. Below are the real retail sales quarterly annualized percent change. The graph displays up to Q2 2013.
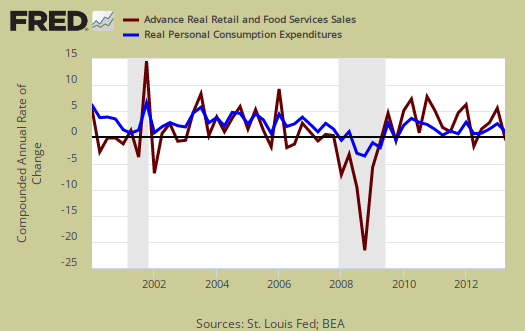
Below is a graph of real PCE against real retail sales, quarterly. See how closely the two track each other? PCE almost looks like a low pass filter, an averaging, removal of "spikes", of real retail sales. Here are our overviews for PCE. Here are our overviews of GDP.
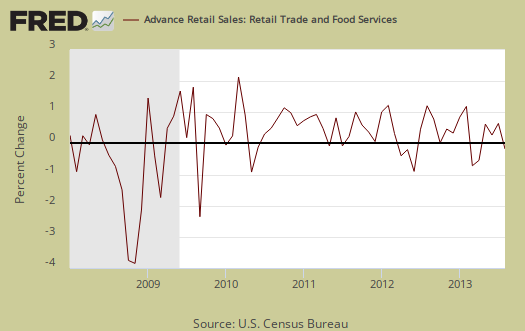
Retail sales are not adjusted for price increases, not reported in real dollars. Real economic growth adjusts for inflation. Retail sales has variance, margins of error, and is often revised as more raw data comes into the U.S. Department of Commerce (Census division). For example, this report has an error margin of ±0.5%. Data is reported via surveys, and is net revenues of retail stores, outlets. Online retail net revenues are asked in a separate survey of large retail companies (big box marts). This is also the advanced report. To keep the monthly nominal percentage changes in perspective, below is the graph of monthly percentage changes of retail sales since 2008.
For the three month moving average, from June to August, in comparison to March to May, retail sales have increased 1.4%. This implies a 5.6% annualized increase. The retail sales three month moving average in comparison to a year ago is up 5.4%. This implies some slightly better spending overall as shown the below graph of quarterly annualized retail sales percentage change, up to Q2 2013.
Seasonal adjustments are aggregate and based on events like holidays associated with shopping, i.e. the Christmas rush. Advance reports almost always are revised the next month as more raw sales data is collected by the Census. In other words, do not get married to these figures, they will surely be revised. Here is our retail sales topic category.
Here are past retail sales overviews, unrevised.
Retail sales the press is wrong
So many in the press are claiming this report implies lower consumer spending and thus lower GDP. Sorry, first we're missing September. But more importantly, consumer spending as part of economic growth has price increases removed. A huge reason retail sales increases is due to increases in gas prices. Needless to say GDP is reported in real values, i.e. chained 2009 dollars which removes inflation. Secondly, retail sales is simply not consumer spending. The majority of consumer spending is on basic living, such as utilities, health care, which are not part of this discretionary spending report. Yes, PCE and retail sales are correlated but finally if one looks at the monthly changes, there is nothing here to imply some consumer spending implosion, just not the sudden magical gains.
Why Wall street would think there would be magical sudden gains in retail sales in beyond me. Wages are down, people are out of work and credit is also down. Gotta wonder if some in the press even read these reports, or have the faintest fell for them before writing.
July retail sales revisions greater than entire August increase
July revisions showed that for the 2nd consecutive month, the upward revision to the previously reported monthly sales gain alone was actually greater than the entire sales gain of the reporting month.... total retail and food services sales for July were originally reported at a seasonally adjusted of $424,481 million, up just $832 million from June sales; that has now been revised to show sales of $425 657, a $1.815 billion or 0.42% increase over June sales, which are now shown to be at $423 842; hence, this "August" report in effect added $983 million to July's sales...meanwhile, August sales as estimated at $426,563 were up $901 million from July's $425,657 million....so what looks like a weak report is actually shows more than twice as great a sales gain as the headline indicates, due to revisions, which is exactly what we observed in our post on retail last month...
rjs
what do you mean you observed?
That's right, the revision doubled July's gains in addition to not interpreting this report well by the press.
Are you talking about the margin of error and the fact this is advanced, will be revised?
Probably should have spelled that out more, one would think readers would see 0.2 percentage points to 0.4% monthly gain = double, but that assumes one has a "numbers brain".
This is so ridiculous how traders jump on this and initial claims. In the big economic indicator scheme of things, neither is that important.
observed was a link back
the last phase was a hook back to my coverage on retail here last month when a similar upward revision was included and widely overlooked...my point is that the last two reports are stronger than the headlines suggests because in effect they both added 0.4% MoM to retail sales..
moreover, some of the retail businesses reported as weak last month were really much stronger...sales at building material & garden supply stores, originally reported down 0.4%, were actually up 1.8% in July, and non-store (online) sales, who had their July sales reported nearly flat at 0.1% last month, are now seen to have increased sales 1.3% for the month...
rjs
Ah, true, good reason to look at volume graphs
This is the #1 reason I put up so many graphs, generally speaking. Wall Street focuses in on the monthly percent change instead of the trend and overall volume. This report is similar to initial claims, durable goods new orders and housing data, always revised.