
The September 2013 ISM Non-manufacturing report shows the overall index decreased by -4.2 percentage points, to 54.4%. The NMI is also referred to as the services index and the decrease indicates slower growth for the service sector. The business activity index dropped by -7.1 percentage points to 55.1%. Both indexes are still above June 2013 levels.

The comments from survey respondents can be described as varied, yet the instability of the government is clearly throwing a monkey wrench into some service's growth projections. Some comments which stood out:
The turmoil and uncertainty of the current state of politics and the U.S. involvement overseas continues to drag on the economy
Clients still unsure about the economy and business costs - From Professional services
Budgets are uncertain for fiscal year 2014, so some items requiring funding in future years are not being purchased. - From Public Administration
Generally speaking a value above 50 for NMI indicates growth, below indicates contraction. Below are the ISM non-manufacturing indexes reprinted for a quick view.
| ISM NON-MANUFACTURING SURVEY - September 2013 | ||||||
|---|---|---|---|---|---|---|
| Index |
Series Index September |
Series Index August |
Percent Point Change |
Direction |
Rate of Change |
Trend (Months) |
| NMI™ | 54.4 | 58.6 | -4.2 | Growing | Slower | 45 |
| Business Activity/Production | 55.1 | 62.2 | -7.1 | Growing | Slower | 50 |
| New Orders | 59.6 | 60.5 | -0.9 | Growing | Slower | 50 |
| Employment | 52.7 | 57.0 | -4.3 | Growing | Slower | 14 |
| Supplier Deliveries | 50.0 | 54.5 | -4.5 | Unchanged | From Slowing | 1 |
| Inventories | 54.5 | 56.0 | -1.5 | Growing | Slower | 8 |
| Prices | 57.2 | 53.4 | +3.8 | Increasing | Faster | 48 |
| Backlog of Orders | 50.5 | 50.5 | 0.0 | Growing | Same | 2 |
| New Export Orders | 57.5 | 50.5 | +7.0 | Growing | Faster | 2 |
| Imports | 51.5 | 55.0 | -3.5 | Growing | Slower | 4 |
| Inventory Sentiment | 62.0 | 63.5 | -1.5 | Too High | Slower | 196 |
Below is the graph for the non-manufacturing ISM business activity index, or current conditions, what we're doin' now meter. Business activity just really dropped, although the last two previous months so busienss activity soaring. One of the survey respondents claimed their increased business activity was seasonal, implying the growth would not be sustained. Here is the ISM's ordered services sector business activity list:
The industries reporting growth of business activity in September — listed in order — are: Retail Trade; Agriculture, Forestry, Fishing & Hunting; Management of Companies & Support Services; Utilities; Construction; Information; Real Estate, Rental & Leasing; Finance & Insurance; Other Services; Wholesale Trade; Transportation & Warehousing; and Public Administration. The industries reporting decreased business activity in September are: Arts, Entertainment & Recreation; Educational Services; Health Care & Social Assistance; Accommodation & Food Services; and Mining.

New orders also declined by -0.9 percentage points but it still fairly high at 59.6%. New orders are an indicator of future business activity. and construction topped the list of an increase in new orders. Plan old slow demand was one reason given for the decrease in new orders.

The employment index actually decreased -4.3 percentage points to 52.7%. This is really bad news considering the soaring business activity indicator of the previous two months, which due to lag, should have shown up in increased hires this month. One of the more ridiculous comments was a sector was right sizing instead of using the word downsizing and another claimed they could not find people, which we know is absolutely absurd considering how bad the employment situation is across the occupational and skill board. The below ISM services employment graph has been normalized to 50, the ISM inflection point for expansion versus contraction.

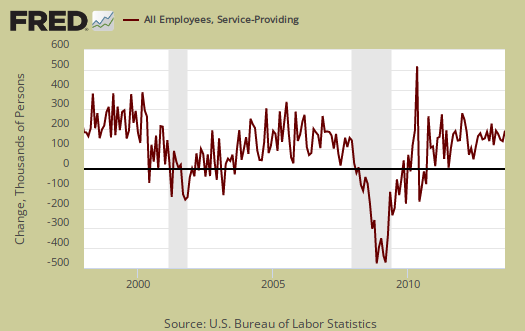
Below is all employees in services as reported by the BLS monthly level change graphed against the ISM services employment index. As we can see they match up reasonably well, although not exact on monthly figures. Yet this is yet another private indicator to use in guessing what the service sector September employment might have been, about one hundred thousand service sector jobs.
Inventories grew but at a slower pace as the index decreased by -1.5 percentage point to 54.5%. One comment said on inventories, stockpiling inventories for jobs won. We must wonder what that comment means since these days the ability to work is like a lottery.

New export orders increased 7.0 percentage points to 57.5 %, which sounds like great news until one discovers only 40% of business track what nation their orders come from. New export orders are from outside the United States, but to be performed by domestically sourced workers. Notice how U.S. citizen/perm. resident labor is not part of this definition. At the top of the new export orders list was Mining services.

Prices paid by the services sector increased 3.8 percentage points to 57.2% and this indicates while prices are higher, they are not soaring like they were earlier in the year.

Order backlogs had no change from last month and is barely growth at 50.5%. This isn't really good news for hiring either, although 38% of these businesses do not track on order backlogs.

Below are supplier deliveries or vendor supplies and it's how fast businesses are getting their stuff to make more stuff. Above 50 is a slow down, which is opposite how many of these sub-indices are defined. Slow-downs mean more demand and also can limit the ability of that business to produce, or business activity. No stuff to make more stuff and you're stuck. This month the index decreased -4.5 percentage points to 50.0%, so supplies are getting to the these businesses at the same rate.

The use of imported materials decreased -3.5 percentage points to 51.5%, which is still growing but at a slower rate. While 52% of survey respondents do not track on their imports, at at the top of the list for import use increase was Arts, Entertainment & Recreation;. Services imports includes BPO, or offshore outsourcing can sometimes be classified as indirect materials. Agriculture was at the top of the list for imports.

Below is the services sector ordered list reporting expansion vs. contraction overall:
The 11 non-manufacturing industries reporting growth in September — listed in order — are: Retail Trade; Management of Companies & Support Services; Transportation & Warehousing; Construction; Utilities; Information; Finance & Insurance; Other Services; Wholesale Trade; Professional, Scientific & Technical Services; and Public Administration. The four industries reporting contraction in September are: Arts, Entertainment & Recreation; Educational Services; Health Care & Social Assistance; and Mining.
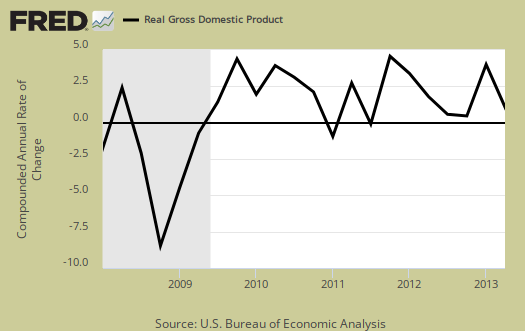
Some in the press are trying to extrapolate Q3 GDP from the services index. Belong large changes, such as the declines in 2009, on a quarterly basis there isn't a lot of rhyme or reason between the NMI composite index, the business activity index and real GDP. We show this in the below graph with GDP on the left, in black, graphed against NMI, in red and the business activity index in green. We're sure if there was a strong correlation, ISM would publish it as well.
The NMI is made up of: Business Activity, New Orders, Employment and Supplier Deliveries, all equally weighted. Here is our past services index, overviews. You might also want to compare the services index to the ISM Manufacturing index.
still expanding
much of the media coverage on this report focused on the lower headline NMI, using expressions like "significantly slower", "downshifts" and "tumbles" to describe the month over month change; they should understand that a reading near 55 still means that a clear majority of purchasing managers reported that conditions in their industry were better than they were last month, when the index was at an all time high....
which highlights my first caveat when considering this report; since ISM has only been producing this index since 2008, it really doesnt have a long enough track record to determine if it's a reliable indicator of service sector business cycles;
my other complaint applies to the manufacturing index as well; as a simple diffusion index where purchasing managers responses in creating the indices are limited to answering whether conditions are "better", "worse", or "the same" as the previous month, no weighting is given for the different sizes of businesses polled, or whether conditions are a whole lot better, just marginally so, or a whole lot worse...
rjs
ISM services title changed 54.4%
Sorry about that, I had the wrong figure in the title, it is now corrected. Amazing isn't it, how so much coverage in the financial press doesn't get the ISM inflection point?
A change in percentage points in their index is not the same as say a percentage change in most economic reports. 54.4% is still expanding and if one looks at the history, this is better than June.