
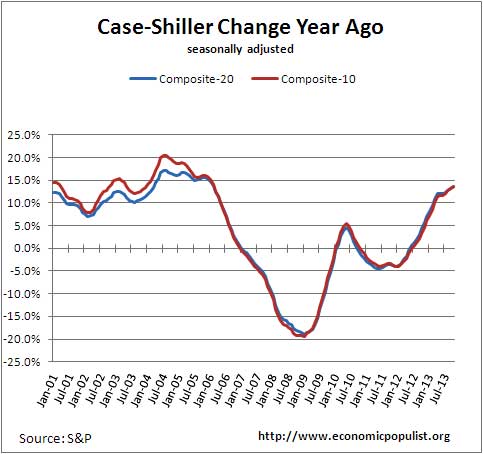
The October 2013 S&P Case Shiller home price index shows a seasonally adjusted 13.6% price increase from a year ago for both the 20 metropolitan housing markets and the top 10 housing markets. This is an incredible price run up and has not been seen since the height of the housing bubble, February 2006. America is now only 20% away from the peak of the housing price bubble and the two indexes are comparable to June 2004 levels Home prices have increased for 17 months in a row as shown in the below graph of the annual price increase percentage change.
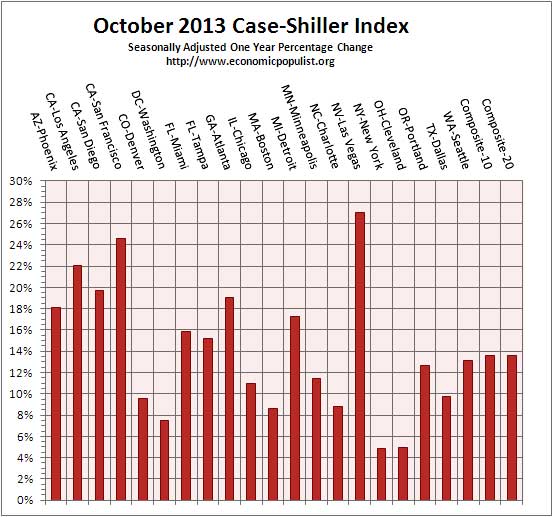
Below are all of the composite-20 index cities yearly price percentage change, using the seasonally adjusted data. We can see some absurd increases in San Francisco, Los Angeles and Las Vegas. Las Vegas has a 10% unemployment rate, one of the worst in the nation, so it is unfathomable these are real people buying these homes and not investors and flippers. Los Angeles is even worse with a 13% unemployment rate. According to S&P, the midwest showed some housing price gains that have not been seen previously, abet they are using not seasonally adjusted data.
Chicago recorded its highest annual rate (+10.9%) since December 1988. Charlotte and Dallas posted annual increases of 8.8% and 9.7%, their highest since the inception of their indices in 1987 and 2000.
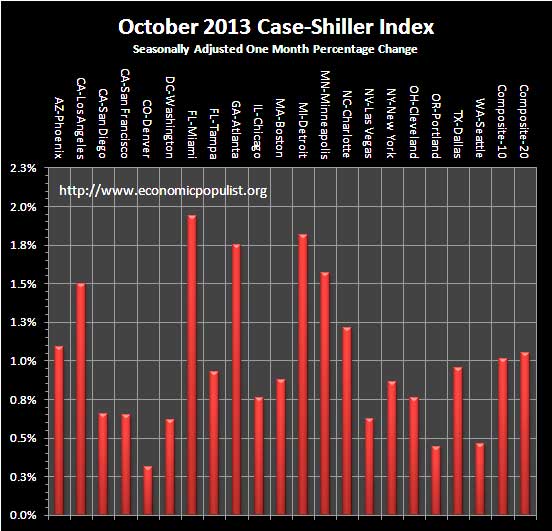
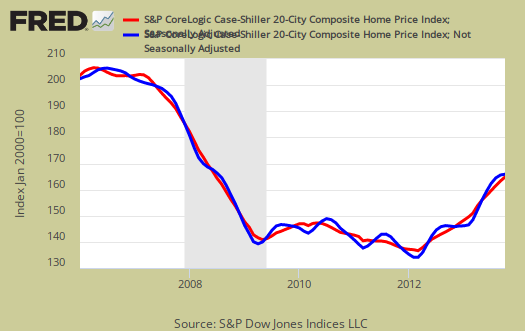
S&P reports the not seasonally adjusted data for their headlines. Housing is highly cyclical. Spring and early Summer are when most sales occur. See the bottom of this article for their reasoning. For the month, the not seasonally adjusted composite-20 percentage change was 0.2% whereas the seasonally adjusted change for the composite-20 was 1.1%. The monthly not seasonally adjusted composite-10 percentage change was 0.2%, whereas the seasonally adjusted composite-10 showed a 1.0% increase. This is fall, so the not seasonally adjusted increase should be less than the seasonally adjusted composite-20. The below graph shows the composite-10 and composite-20 city home prices indexes, seasonally adjusted.
S&P is reporting this is the end of the party on increasing home prices and state monthly numbers show we are living on borrowed time and the boom is fading. They note the effect of quantitative easing by the Fed as one reason the party is over. It is expected as the Federal Reserve stops sopping up mortgage backed securities, mortgage interest rates will rise, yet there still is over a third of all cash home purchases and the report estimates price increases will be in annual single digits. Considering most people cannot afford a home anymore, outpacing income levels by almost 50%, double digit price increases for new home owners are clearly unhealthy. This is in spite of the estimated 6.4 million mortgages still underwater.
Case-Shiller indexes are prices are normalized to the year 2000. The index value of 150 means single family housing prices have appreciated, or increased 50% since 2000 in that particular region. Case-Shiller indices are not adjusted for inflation. The below graph shows the seasonally adjusted indexes.
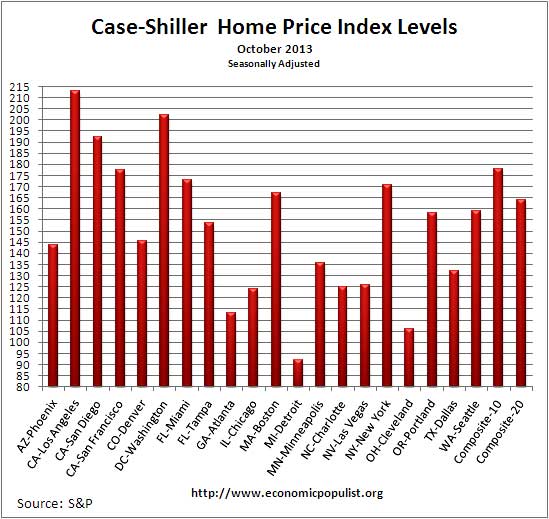
Some in the press use the seasonally adjusted data, and others do not. Some report the monthly change, others the annual change. To make matters worse, some in the press do not specify which statistic they are quoting from S&P. Below are the seasonally adjusted indices for this month. The above graphed index itself tells you what has happened to home prices, per city, from the year 2000. Only Detroit is below their 2000 home price values. Poor Detroit and don't expect any great recovery as the city declared bankruptcy just recently.
To Season or Not to Season, That is the Question:
The S&P/Case-Shiller Home Price Indices are calculated monthly using a three-month moving average and published with a two month lag. Their seasonal adjustment calculation is the standard used for all seasonal adjustments, the X-12 ARIMA, maintained by the Census.
So, why would S&P report the not seasonally adjusted data? According to their paper on seasonal adjustments, they claim the not seasonally adjusted indices are more accurate. It appears the housing bubble burst screwed up the cyclical seasonal pattern. What a surprise, although those steep cliff dives are now going back to 2009, one would think the seasonally adjusted data would now start to converge back to it's cyclical, seasonal pattern.
The turmoil in the housing market in the last few years has generated unusual movements that are easily mistaken for shifts in the normal seasonal patterns, resulting in larger seasonal adjustments and misleading results.
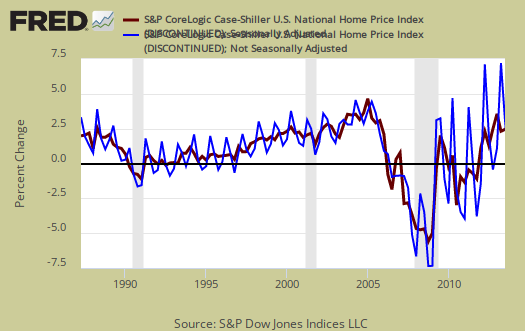
To see S&P's argument in action, look at the below graph. The maroon line is the seasonally adjusted national index, reported quarterly. The blue line is the not seasonally adjusted national index. As we can see before the housing bubble burst, we see a typical cyclical pattern difference between the seasonally adjusted and not seasonally adjusted data points. Yet after the bubble burst we see large swings, which would throw off a seasonal adjustment adaptive algorithm. This is going to become a major question among statisticians, how does one adjust for seasonality in the face of tsunami like economic events? Is it now long past the housing bubble collapse, yet we can see the seasonal adjustments still are not completely matching up from the year ago percent changes, which implies they are still off statistically.
Not seasonally adjusted data can create more headline buzz on a month by month basis due to the seasonality of the housing market. S&P does make it clear that data should be compared to a year ago, to remove seasonal patterns, yet claims monthly percentage changes should use not seasonally adjusted indices and data. This seems more invalid than dealing with the statistical anomalies the massive housing bubble burst caused. Below is the seasonally adjusted and not seasonally adjusted Composite-20 Case-Shiller monthly index, for comparison's sake.
Graphed below is the yearly percent change in the composite-10 and composite-20 not seasonally adjusted Case-Shiller Indices.

For more Information:
S&P does a great job of making the Case-Shiller data and details available for further information and analysis on their website.
Here is our Case-Shiller past overviews as well as the overviews of residential real estate statistics.
adjusting Case-Shiller indexes for inflation
quite coincidentally, we benchmarked our own inflation guages of CPI components to the year 2000, the same year as these indexes are benchmarked to, so we can see that the housing component of the CPI is up 38% since then…
rjs
graph, link for home prices adjusted for inflation
The graph, sorry, is unreadable and is just various CPI indexes it appears. S&P did an index adjusted for inflation.
From November past overview.
just seredipity
ok, a full explanation of that graph is here...i should have noted that the housing component of the CPI was tracked by the red line, and the rest of the graph was irrelevant..
it was not so much that it is a perfect inflation adjustment, but that it was benchmarked to 2000 = 100, just as case-shiller is...there are two major benchmarkings of composite CPI indexes, some with 1982-84 = 100, some with 1997 = 100....i reset both types of CPI composites to 2000 =100 so i would be comparing apples to apples on the same graph
rjs
graphs
You can change the color, the size and the timeline on edit, so I would suggest trying to make them readable. For example, if you want to just show housing inflation, just graph that CPI series and maybe overall CPI against it.
Trust me, getting people to see a visual and understand it is tough enough, but when one makes a graph so busy it becomes impossible.
Also, I have serious issue with FRED beta so try not to use it. I don't have a solution but it might be this site has to abandon using FRED altogether! You might complain to them about it.