
February 2014 Retail Sales increased 0.3% for the month. This is the first increase in three months. January was revised all the way down to -0.6% and December's drop was -0.3%. Retail sales have now increased just 1.5% from a year ago. January's decline was due to a real nose dive in auto sales, down -2.3% for the month. Online retailers continue their rise with a 6.3% increase from a year ago. Retail sales are reported by dollars, not by volume with price changes removed.
Retail trade sales are retail sales minus food and beverage services and these sales also increased 0.3% for the month.. Retail trade sales includes gas. Retail sales without gasoline purchases increased 0.3% for the month.
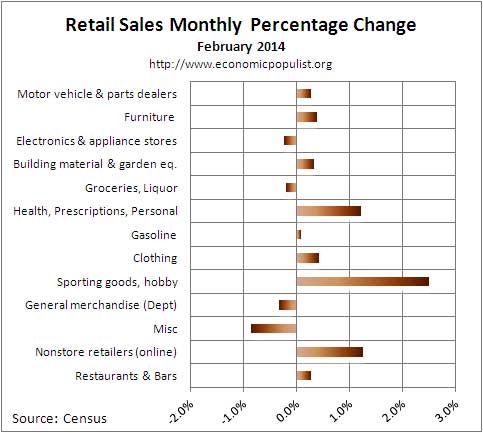
Total retail sales are $427.2 billion for February. Below are the retail sales categories monthly percentage changes. These numbers are seasonally adjusted. General Merchandise includes super centers, Costco and so on. Health and personal care sales have increased 5.5% from a year ago, largely due to prescription drugs.
Below is a graph of just auto sales. We see how the recession just decimated auto sales and also how autos have dropped off recently with a 2.2% increase for the year. Budget cuts and government shutdown games can impact auto sales as governments use large fleets of autos and trucks. Going for a test drive in a polar vortex probably also really hurt auto sales.

Department stores are clearly hurting. Their retail sales are down -4.8% from a year ago. Obviously people are shopping at department stores less and less as online shopping is becoming increasingly more common. Building materials, garden sales, which are large by volume, have increased 3.2% from a year ago. Grocery stores have increased sales by 2.4% from this time last year and for the month were down -0.1% Sporting goods, hobbies, books & music sales have are down -5.2% from last year. Miscellaneous retail stores have increased 1.4% from a year ago, but are down -0.9% for the month. Electronics and appliances are down -2.4% for the year,-0.2% for the month.
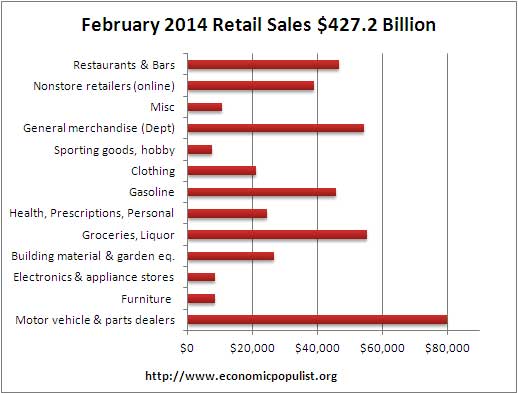
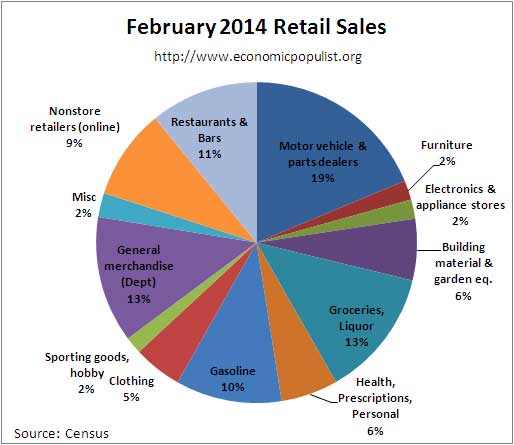
Below are the retail sales categories by dollar amounts. As we can see, autos rule when it comes to retail sales. We also see online retailers are really making a dent in their importance to the economy.
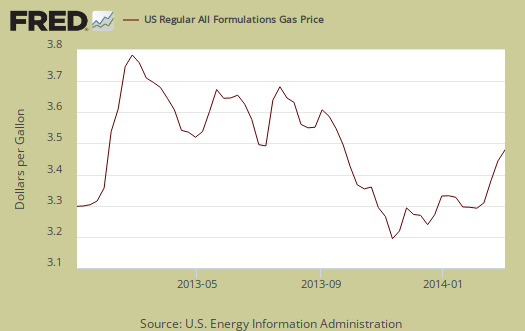
Graphed below are weekly regular gasoline prices, so one can see what happened to gas prices in February. They were basically bouncing around, so actual gas volume use might have increased as sales grew by 1.6% for the month.
The below pie chart breaks down the monthly seasonally adjusted retail sales by category as a percentage of total February sales by dollar amounts. One can see how dependent monthly retail sales are on auto sales by this pie chart. We also see non-traditional retailers making strong grounds on traditional general merchandise stores and almost equal to gasoline sales in terms of importance.
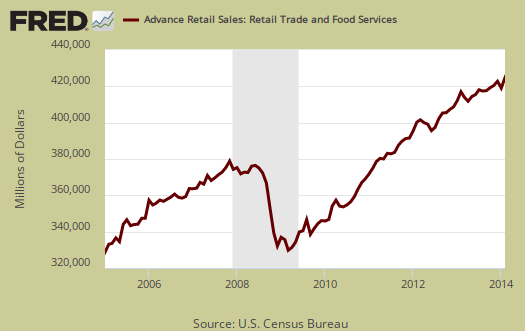
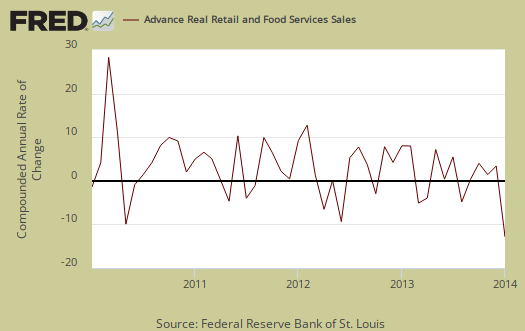
Retail sales correlates to personal consumption, which in turn is about 70% of GDP growth. Yet GDP has inflation removed from it's numbers. This is why Wall Street jumps on these retail sales figures. Below is the graph of retail sales in real dollars, or adjusted for inflation, so one gets a sense of volume versus price increases. Below is the annualized monthly percentage change in real retail sales, monthly, up to January 2014. This is a crude estimate since CPI is used instead of individual category inflation indexes. The below graph is quite a nasty foreboding of what consumer spending might shape up to be for Q1 2014. Very ugly graph.
Below is a graph of real PCE against real retail sales, quarterly, up to Q4. See how closely the two track each other? PCE almost looks like a low pass filter, an averaging, removal of "spikes", of real retail sales. Here are our overviews for PCE. Here are our overviews of GDP.

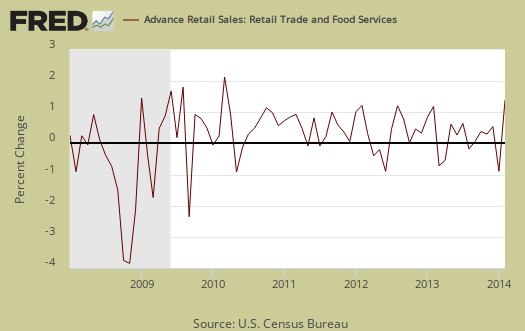
Retail sales are not adjusted for price increases, not reported in real dollars. Real economic growth adjusts for inflation. Retail sales has variance, margins of error, and is often revised as more raw data comes into the U.S. Department of Commerce (Census division). For example, this report has an error margin of ±0.5%. Data is reported via surveys, and is net revenues of retail stores, outlets. Online retail net revenues are asked in a separate survey of large retail companies (big box marts). This is also the advanced report. To keep the monthly nominal percentage changes in perspective, below is the graph of monthly percentage changes of retail sales since 2008.
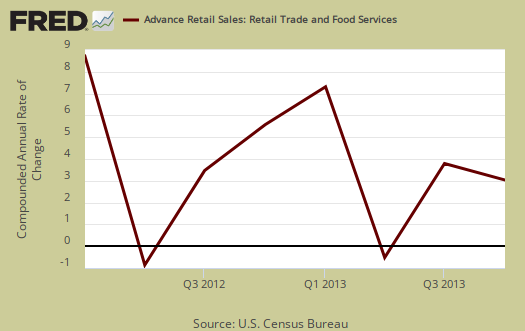
For the three month moving average, from December to February in comparison to September,-November retail sales have declined by -0.3%.  This is really not good news and will probably result into lower consumer spending for Q1 2014. It also appears auto sales were the Debbie Downer of the three month moving average. ;The retail sales three month moving average in comparison to a year ago are up 2.3%. Overall as shown the below graph of quarterly annualized retail sales percentage change, up to Q4 2013.
Seasonal adjustments are aggregate and based on events like holidays associated with shopping, i.e. the Christmas rush. Advance reports almost always are revised the next month as more raw sales data is collected by the Census. In other words, do not get married to these figures, they will surely be revised. Here is our retail sales topic category.
Here are past retail sales overviews, unrevised.
retail employment heading south
most of last year, when retail sales were at least increasing monthly, we were seeing 20, 30 or 40 thousand retail jobs being added each month...now, with retail sales in the dumper, that employment has fallen for two months consecutively...there's a very good correlation between those store types where sales are falling, especially YoY. and those who've had the largest layoffs..
ie, specialty shops, such as sporting goods, book and music stores, with sales down 5.2% YoY, cut 8,600 jobs in the last payrolls report; department stores cut 6,600; and electronic and appliance stores, which have seen sales decline 2.4% from last year, lost another 12,000 jobs in February..
http://www.bls.gov/news.release/empsit.t17.htm
rjs
Amazon, monopoly, then raises prices
Amazon is the reason,they undercut local retail and now because these stores are closing, they are raising prices. Prime is now $99, which means you had better be ordering a hell of a lot of stuff to justify paying it.