
The Manufacturers' Shipments, Inventories, and Orders report shows factory new orders declined by -0.2% for January. The reason was most likely oil as nondurable goods new orders plunged by -3.1%. Petroleum refinery shipments give another clue as they plunged by -11.6%. Durable goods new orders by themselves increased 2.8%. Transportation new orders propped up overall factory orders as without them, new orders would have declined -1.8%. December Factory Orders dropped by -3.5%. This is the sixth month in a row factory orders has declined. The Census manufacturing statistical release is called Factory Orders by the press and covers both durable and non-durable manufacturing orders, shipments and inventories.

Transportation equipment new orders increased 9.7% , but that's all volatile nondefense aircraft, which increased 128.7%. Motor vehicles bodies & parts new orders had no change at all.
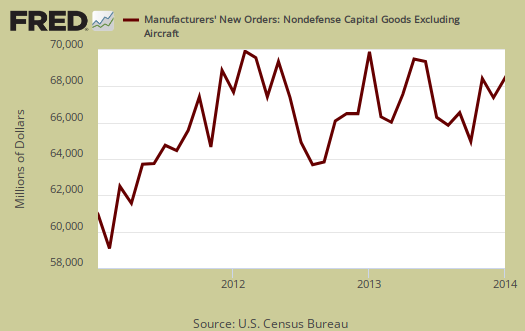
Core capital goods new orders increased by 0.5%. The previous month showed a -0.5% decline, which basically makes core capital goods new orders for two months a net zero. Core capital goods are capital or business investment goods and excludes defense and aircraft. This is indicating slower economic growth.
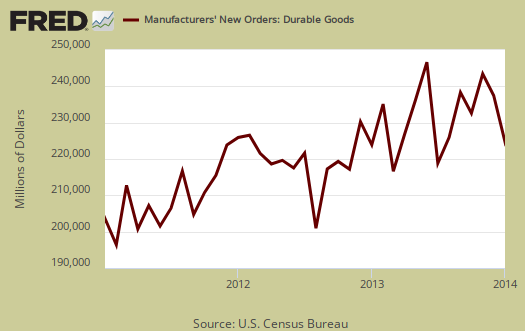
Nondurable goods is having a rough time with a -3.1% drop. The previous month was a -3.3% decline. Manufactured durable goods new orders, increased 2.8%, yet December durable goods new orders decreased by -3.7%.
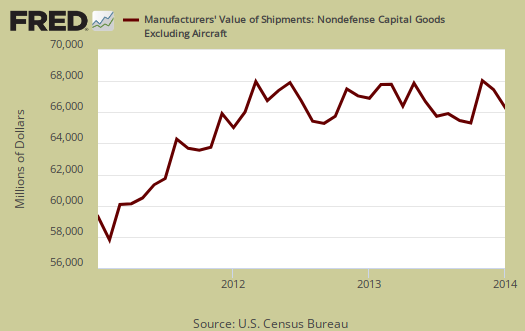
Shipments overall decreased -2.0%. Nondurable goods shipments depth charged with a -3.1% loss as petroleum shipments nose dived by -11.6%. Core capital goods shipments increased 0.1%, or barely nudged. Core capital goods shipments go into the GDP calculation. Below is a graph of core capital goods shipments.
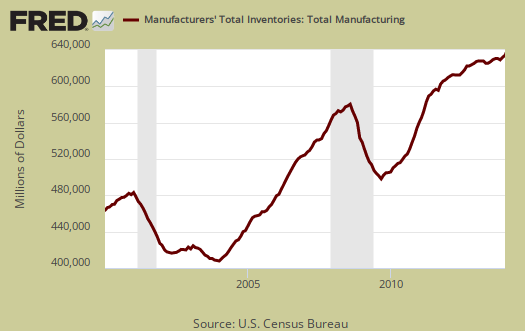
Inventories for manufacturing overall declined -0.4%. Again we see oil impacting inventories dramatically. Durable goods inventories increased 0.4% while nondurables decreased -1.7%. Petroleum refineries inventories plunged by -11.3% as gasoline producers are obviously desperate to decrease supply and push prices back up.
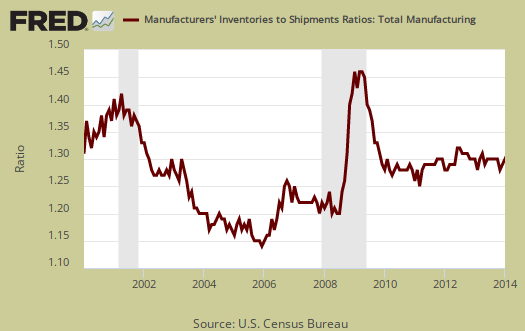
The inventory to shipments ratio increased to 1.36. Increasing ratios can imply economic sluggishness.
Unfilled Ordersdecreased -0.2%. Core capital goods unfilled orders had no change and in durable goods decreased -0.2%.
Part of this report goes into calculating GDP. The BEA takes this report, called M3, and uses the shipments values to calculate investment in private equipment, investment in software. Manufacturing inventories also goes into the changes in private inventories GDP calculation. At the bottom of this post is a little more information to estimate part of the GDP investment component.
The St. Louis Federal Reserve FRED graphing system has added individual NAICS data series from this report. If you're looking for a graph of some particular NAICS category, such as light trucks, autos & parts, or machinery, it might be found on FRED. Most news outlets source the Commerce Department, while technically correct, also makes it impossible for you, our beloved detailed reader, to find the actual statistical report and data which you might be focused in on. There is much more detail in the statistical tables published by the Census website for manufacturing statistics.
The Great Deception
After the "Great Recession" we got the "Great Deception"
@TruthOut
http://www.truth-out.org/news/item/29447-what-trickle-down-economics-has...
real factory inventories
while inventories for all manufacturing industries fell 0.4% in January, inventories for durable goods rose 0.4%, slightly less than the 0.5% inventory increases of each month in the fourth quarter...it was inventories of nondurable goods, which fell by 1.7%, that dragged down the total, but on a current dollar basis 13% of nondurable inventory was inventories at oil refineries, which were 11.3% lower in January after falling 11.4% in December...but prices for refinery products were down even more, with producer prices for gasoline off 24.0%, and prices for diesel fuel, home heating oil, and other distillates all falling more than 19%...hence, we can say that real inventories at refineries were probably up 8%, and maybe more...and if we subtract refinery inventories from other non-durable goods, we find other inventories were only down a bit over 0.1%...but factory prices for most of those non-durable goods fell as well, as producer prices for food were down 1.1% in January, while core producer prices were down 0.2%...since food and beverage inventories account for roughly 30% of non-durable inventories, and chemical inventories, which were down 9.2% in price, account for another 34% of the total, we can confidentially say there was a substantial build of real non-durable inventories in January as well...
rjs
nice addition
I caught that this was all energy but adding in the deflationary aspects plus durable is nice, thx.
tried something different
i was bored with just reporting the numbers so i decided to try to figure out how last weeks reports would impact GDP...it was more work than i expected, and i probably have as large a margin of error as the census housing reports, but at least it was a different take than the usual...
rjs
estimates
I've done them but they take time, so good for you. That's the kind of information people really want from these overviews, not what is already said by the BEA/Census/BLS.