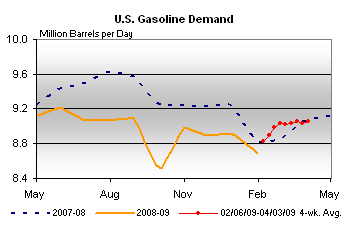
This may be the most important economic graph of the year:

Why? The above graph shows gasoline consumption in the US. The dotted blue line is April 2007-March 2008, the yellow line the remainder of 2008, and the chained red line this year's consumption.
Let us make a not unreasonable assumption that this recession is going to be somewhat "L" shaped or at least a Verizon-logo like elongated "V" with a very slow recovery after hitting bottom. Let's also assume optimistically that we are somewhere near the bottom of the cliff -- the inflection point of the "L" or "V".
How much of a recovery we get -- or worse, if we get a double-dip "W" recession -- is likely to be substantially determined by the price of Oil later this year.
It is well to keep in mind that there have been two separate stages to the recession that began in December 2007. In the first stage, as stress from the housing bust intensified, the dollar lost value precipitously, and Oil meanwhlle rose from about $80/barrel to $145/barrel by July 2008. No sooner did the Oil bubble break than the second phase of the recession kicked in with Black September on Wall Street.
At about $80/barrel, gasoline crossed the $3/gallon threshold and consumers started crying Uncle.
Because gasoline is used by just about all income groups in similar amounts, $3 and even $4/gallon gasoline tremendously stressed lower income consumes (as opposed to the subsequent Black September 401k collapse that primarily impacted upper income earners).
When Oil fell from $147/barrel in July 2008 to $35/barrel in December and January, Joe/Jane Sixpack got a reprieve of something like $150/month (based on a guesstimate of 1500 miles a month at 25 miles/gallon) in increased disposable income.
The results of that rebate to consumers are easy to see in the graph above. At $35/gallon, consumers started to use more gas. As prices have increased over $50/gallon, it looks like consumers have started to pull back again.
That Oil bottomed at $35/barrel in January is not surprising. Typically Oil has had a seasonal increase from winter to summer, and the 75% collapse in price was extreme. What has been a little bit of a surprise was how much the bounce off that bottom has been reflected in the inflation rate for January and February -- CPI for the first two months this year is actually greater than for the same period last year:

If Oil continues to rise, as does CPI inflation, it is possible that the $3/gallon pain threshold will be reached again, choking any incipient recovery at birth, and leading to a renewed consumer retrenchment. Contrarily, if Oil remains subdued, at least some of the consumer "rebate" will be continued, and will aid in any recovery.
Let's return to our graph for a moment: notice that the red line has returned to the 2008 trend of lower use, and indeed may be crossing it towards the downside. No doubt some of this is the effect of rapidly increasing unemployment. Nevertheless, let us cross our fingers that this means that demand for gasoline will remain relatively subdued and that Oil will not soon rise again to the pain threshold, with the renewed reduction of consumer saving/exportation of dollars to Petrosheikhdoms/round 3 of recession that implies.

Comments
nice insight
on how it affects overall consumer spending and ability to pay other bills.
Real retail sales will be reported next week
I'm working on a follow up to this post, once that number is reported.
Hopeful sign.
Based on this news report it seems that OPEC is willing to play along for this year (h/t theoildrum.com)
It's still tricky looking longer term. The Saudis would like to see a stable long term price of $75 per barrel. I believe the break even for Canadian Oil Sands is around $85 per barrel. And I have read that the Canterel fields in Mexico will soon be producing at levels sufficient only for domestic consumption. Additionally, low oil prices continue to take oil fields out of production and reduce exploration.
We certainly have a financial crisis on our hands now but ultimately, we will have to confront an even more serious commodities crisis.
Good story via the link
Thanks.