
The news out today told a story of Americans going back to their puritan fiscal roots.
Americans Pay Back Debts Most Since ‘52 as Jobless Spur Savings(Bloomberg) -- For the first time since Harry S. Truman was in the White House, Americans are paying back their debts, a phenomenon that just might help keep interest rates low as the Treasury sells a record $2 trillion of bonds and rising unemployment increases U.S. savings.
The stable rock of the American citizen, repairing his balance sheet so that the Great American Economy can recharge with a clean slate, healthy and ready to take on the world. American Capitalism in action, continuing to work in the same way it has worked for hundreds of years.
At least that is what the first paragraph implies. Once you scratch the surface the story isn't nearly so pretty.
For instance, let's look at the second paragraph of this story.
While the proportion of consumers without jobs rose to 9.5 percent last month, household borrowing fell to 128 percent of the average family’s after-tax income in the first quarter from a record 133 percent in the same period a year earlier, according to data compiled by Bloomberg. The total debt of individuals, nonfinancial companies and federal, state and local governments grew at a 4.3 percent pace at the start of the year, down from a peak of 9.9 percent in the fourth quarter of 2005, Goldman Sachs Group Inc. estimated.
Uh, if total debt is increasing then how is the country supposedly paying down its debts?
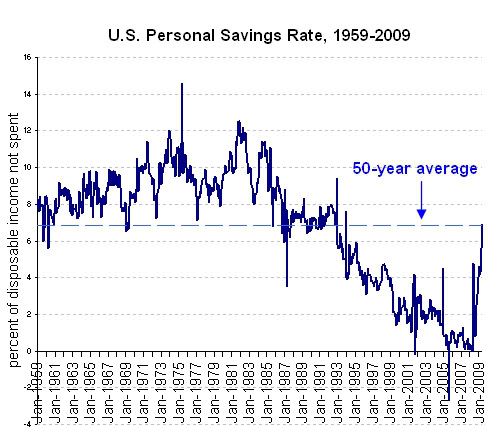
Let's ignore that question for now, and look deeper at the Commerce Department numbers. Their claim is that the savings rate is 6.9% in May, the highest since 1993.
It sounds impressive until you put it into perspective, by looking at where we are coming from. For instance, in 2007 Americans saved $57.4 Billion. At the same time they gambled away $92.3 Billion. That's a far cry from our puritan roots.
Americans are being forced to save now because their net worth has taken a brutal double-punch from the housing bubble bust and stock market crash.
But have Americans really started saving at a 6.9% rate? Let's look at how the Commerce Department puts together their numbers.
The Commerce Department measures total personal income, then deducts personal spending to arrive at what was saved.
...
That's what happened in May: One-time federal stimulus payments of $250 each to retirees and others receiving government aid -- so-called transfer income -- drove total personal income up 1.4% from April, while spending rose a modest 0.3%.That boosted what the government calculates was left in people's pockets. Savings as a percentage of total disposable income jumped to 6.9% from 5.6% in April.
That one-time event merely moved private debt to public debt. The debt didn't actually get paid off.
Of course that isn't the only way that the numbers are skewed.
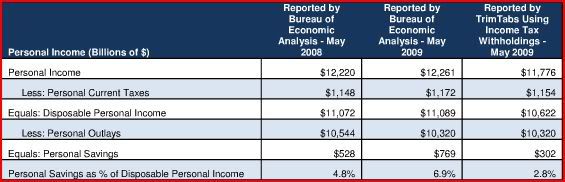
Trimtabs broke the numbers down to more basic elements.
Our analysis based on real-time income tax deposits indicates the real savings rate is a paltry 0.9%. Consumers are in much worse shape than government statistics suggest and have little money left over to repair their tattered balance sheets.
Trimtabs attacks the Commerce Department's most basic assumptions about wages and salaries.
the BEA is overstating income from wages and salaries and income from non-wage sources, which inflates the savings rate. Income tax deposits to the U.S. Treasury, which are reported in the Daily Treasury Statement (DTS), show the economy is contracting much faster than the BEA is reporting. Using this real-time data, we estimate the savings rate was only 2.8% in May.
Trimtabs also subtracts both the short-term "Make Work Pay" tax credit, and the $250 one-time stimulus payment earlier this year, thus we arrive at a 0.9% savings rate.
Trimtabs criticizes the BEA for using the Quarterly Census of Employment and Wages (QCEW), which is based on quarterly tax reports. The problem being that many employers pay unemployment taxes on only a small portion of their workers' salaries, and many of these payments are made at the beginning of the year.
Using the DTS instead of the QCEW, personal income would have fallen 3.6% y-o-y in May, rather than the 0.3% that the BEA reported.
That's not to say that the BEA doesn't go back and revise their reports so they are more accurate. They just do after the numbers no longer have much meaning.
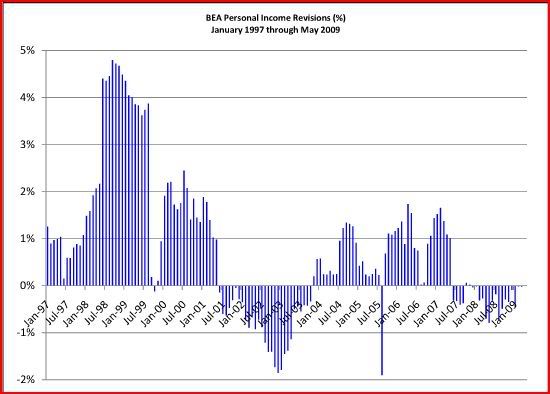
Once you look at real-time data, rather than BEA projections based on past quarterly data, the Green Shoots numbers wither and die.
Forecasts of positive economic growth by Q4 2009 are wishful thinking. Our real-time indicators show declines in wages and salaries are accelerating. Adjusting for the “Making Work Pay” tax credit, wages plunged 6.2% y-o-y in the past four weeks, worse than the 4.8% y-o-y decline in May and the 5.8% y-o-y decline in June.
...
July 4 was on Saturday this year and on Friday last year. Even with the boost from this additional withholding day, withholdings fell an adjusted 6.2% y-o-y in the past four weeks. “Other” taxes plunged 32.7% y-o-y in the past four weeks after falling 35.6% y-o-y in Q2 2009. Corporate income taxes fell 32.2% y-o-y in the past four weeks after dropping 36.7% y-o-y in Q2 2009. Incomes are dropping much faster than government statistics are measuring.
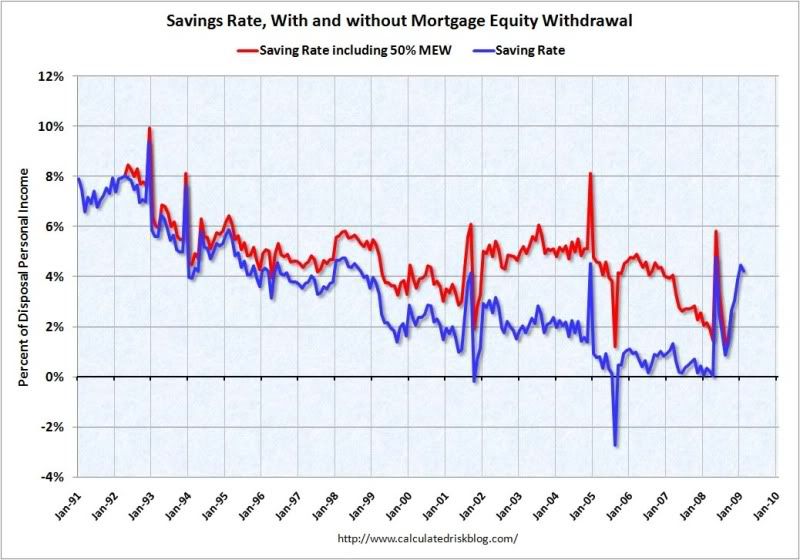
So why do BEA numbers showing a phantom, rising savings rate? The reason is largely due to the bursting of the housing bubble, which has cut off home equity withdraws.
Comments
Speak of the devil!
I'm so glad you researched this out and wrote about it. I just put in a comment what bullshit that MSM "noise" is but I didn't have time to research and trace the "savings" out.
I believe the jump can be traced to Stimulus tax cuts, payouts, esp. to Senior Citizens who pocketed the dough and in terms of "pay off their debts" (uh huh) could that be charge off? i.e. Americans defaulted in record numbers hence the active debt ratio dropped? With 3.2M mortgages this year (projected) in foreclosure, that implies bankruptcy, which will at minimum reduce the official debt load.
Incomes have been inflated by "stimulus" tax cuts and rebates.
But consumer credit is going down:
1) Consumer Credit decreased at an annual rate of 1-1/2 percent in May 2009. But rate of decrease has slowed. Could it be that we are re-inflating the bubble?
2) And after reaching a high of 14.2% of DPI (10/1/06) household debt service payments dropped to 13.48% of DPI (1/1/09)
Now, this could be a function of, as Robert said above, that foreclosures are forcing this decrease. But revolving credit went from $960.9 billion in December 2008 to $928 billion in May 2009
RebelCapitalist.com - Financial Information for the Rest of Us.
Thank you for hard research and excellent write up
I have been wondering for months how it was possible that the "savings rate" could be increasing at the same time that personal income in shrinking because of job losses. I hope and expect that you have posted this in other places.
My local talk show had a State Rep on the show
Apparently the State workers are not getting paid, are not laid off but must show up to work.
On the other hand all Welfare / WIC / Food Stamps are still being paid.
So let me see if I have this correct.
People working are not getting paid.
People not working are getting paid.
Have I fallen down the rabbit hole?
"Plans were made to help thousands of state employees weather payless paydays. Employee health benefits aren't affected. Neither are state welfare and pension payments."
Are you talking about California, the FUBAR state?
California is a world unto itself. If someone is illegal, they will assuredly get state assistance, if someone is desperate, elderly or disabled, it's guaranteed they will get screwed. Teach in Spanish but screw the homeless and so on. I saw the "deal" on the budget and it is so ridiculous, a lot of accounting tricks, screwing the poor, those with the least political clout and ignore the $10.5 billion paid yearly on illegal immigrants and ignore the political favors, paybacks and other government bloat and of course they can't raise any taxes even though their property taxes just imploded.
The real need for CA is a new constitution. They have to do something to break that political cronyism, 2/3rd majority to do anything log jam.
My report was on PA
Starting in 1974, I lived for thirteen years in CA. Way back then, when I saw the voting ballot printed in 7 different languages, creating multiple - multiple pages, I knew CA liked to waste money.
I'm still reading the Health Bill. I have not found anything to prevent someone from gaming the system. If all people must be given insurance, I have yet to see anything to prevent moral hazard.
Example: If a family of 4 have an income of $40,000 a year, if they choose not to buy insurance (public or private) they would get an 8% tax fine. That would be a $3,200 tax fine.
Now I doubt if even a public plan can offer to cover a family of 4 for $3,200 a year. So the above person would make out by just paying a fine. When they get the cancer diagnosis, they go to (public or private) insurance and the insurance plan will need to pay out a possible $100,000 or more. Hm?
I've done some quoting on the Swiss site that gives quotes if you are a Swiss resident. I can tell you that a family of three costs from 7,886.40 CHF to 14,808.00 CHF a year ($300 ded. per incident). Quotes are based on living near Geneva. IF I want a hospital covered outside my Canton (like our States) or want a choice such as doctor, you need to add on supplemental insurance. Many Swiss people pay the "top up" supplementary insurance.
Or better yet, if you are someone living under the radar, the drug dealer, the illegal alien, etc. you wouldn't even be paying a fine. So when they get the cancer diagnosis, they waltz in to an insurance company, plop down a months premium and say.....start paying my bills.
We are living in a world where the elected officials are crazy!
Seems that the elected officials have no need to care about the money of working people.
I haven't read it
waiting for the dust to settle. But so far what I see is private insurance companies protecting their profits at all costs. The reality is they could easily reduce costs, massively, which do not affect choice or quality of care, access to care in the least! But they won't remove all of those bastards making huge bucks off of sick people.
Just look at lab tests as an example. It's absurd, with technology one could easily make those very cheap and accessible....yet "interests" won't do that.
Paperwork, it's insane, even billing is beyond belief complex, again to protect a lot of "interests".
Then you have MDs who refuse to treat anyone on either Medicaid or Medicare. That should be plain illegal.
The list goes on and on and on but we don't hear any of this, we hear "on that's socialist" or "we need reform now" when the reality is it's a rigged game, antiquated nightmare system and it's the system itself that needs a complete overhaul and that does not imply one has to go to any of these solutions....
so I don't see this details being discussed, only the single payer, not for profit people are.
Bob you are normally not so far off frommy views but
I ran an investment business for 20 years and was a State RIA for two years. Over the years I did a lot of research for clients that wanted safe investments, not growth stuff and would look at insurance companies.
You seem to think that health insurance has a big profit margin and historically that is not true.
I can tell you how to save a quick 2 or 4 percent off the top. Make the States stop their gross premium tax. A gross premium tax is on premiums collected, not after expenses.
Insurance agents (those people everyone loves to hate) make about 3% commission from Blue Shield / Cross. Commissions decline after first year. Private insurance companies could if they wanted, follow Medicare's model and have a skeleton fraud unit. Insurance companies are vigilant on fraud and it does cost (if I remember) maybe 5% to 8%. But it saves $millions maybe $billions.
.Experts say all of these services cost more today than they did 15 years ago, even accounting for inflation
Although spending has slowed, the problem is it has not slowed enough. The cost of providing health care to people with private insurance still grew twice as fast as the overall U.S. economy last year.
CONSOLIDATED STATEMENTS OF OPERATIONS
(in thousands, except per share data)
Total operating revenues
3,573,589
Total operating expenses
3,500,675
Earnings before income taxes
70,668
Provision for income taxes
26,500
Net earnings
$
44,168
Here is the S&G expenses
Selling, general and administrative as a percentage of revenue
16.1%
The above is far from the 30% I always hear. That S&G costs are people, secretaries, the person working in the mail room and yes...that possibly/probable overly paid CEO. S&G costs don't mean that they are useless and don't offer value.
As I have said before, when Medicare starts paying a fraud unit, when Medicare starts including wages for the people over at CMS, I will start to listen. The admin cost the government gives for Medicare is skewed. Another example: Medicare uses a cost per claim analysis. Well the elderly normally have a higher claim than younger people. Private insurance normally has more young, healthy people, therefore the normal client has lower claim amounts. Using the Medicare method for determining administration of claims, even if the same amount of time is spent on the young low claim, Medicare would assign a higher administration ratio to the young, low claim amount. The Medicare math does not give a picture of the cost to adjudicate a claim per person and is what many call misapplication of statistics.
I damn well guarantee you that if Medicare uses the generally accepted administrative cost per person analysis, the low Medicare admin. cost we hear will be gone.
Maybe I go back to my days with hair to my waist (I'm a guy), falling back to my 1960's mistrust of government. But the more I look at their stats the more I find them misleading.
Hm? This got long, maybe it should have gone over to another place. I am always open to new information. So if someone has information that Medicare uses mathematics admin figures that are based on the claim per person.
Here are some arguments over the entire thing.
http://www.stat.columbia.edu/~cook/movabletype/archives/2009/07/does_med...
UnitedHealth Q2 Profits doubled
I don't know where you are getting this, just to to Yahoo Finance, plug in almost any stock for the health sector and there is quite a different story.
This one yesterday, UnitedHealth profit doubles.
Bob SEC reports - check EDGAR if you'd like
Go to whoever you use to read SEC reports and look at the June 2009 8K.
UNITED STATES SECURITIES AND EXCHANGE COMMISSION Washington, D.C. 20549 FORM 8-K United Health Care Group Revenues $ 21.66 billion Operating Margin 6.6 %
UnitedHealth Group’s consolidated second quarter revenues of $21.7 billion increased $1.4 billion or 7 percent year-over-year. Second quarter investment income of $153 million decreased $87 million year-over-year, which reduced net earnings by $0.05 per share. While cash and invested asset balances increased 8 percent year-over-year at June 30, 2009, capital market conditions meaningfully reduced yields on the Company’s cash and short duration, high quality investment portfolio. UnitedHealth Group results included net capital gains of $3 million and $50 million in the second quarters of 2009 and 2008, respectively. Second quarter earnings from operations were $1.4 billion and net earnings were $859 million. The operating margin of 6.6 percent decreased 60 basis points from the prior year operating margin of 7.2 percent, with 40 basis points of the change due to reduced investment income and the balance due to business mix changes driven by strong growth in comparatively lower margin government-sponsored business at AmeriChoice, Ovations and OptumHealth. Second quarter 2009 net earnings of $0.73 per share increased $0.06 or 9 percent from $0.67 per share in the second quarter of 2008.
Minnesota 1-10864 41-1321939 (State or other jurisdiction of incorporation) (Commission File Number) (I.R.S. Employer Identification No.) UnitedHealth Group Center, 9900 Bren Road East, Minnetonka, Minnesota 55343
Robert, I am reading the report and have yet to find the profit they are talking about. I need to read each individual company under the UNH umbrella. I am not sure if by fee based they mean supplying stop-loss for self insurance groups. They have their risk based health plans and I believe that is what we know as regular health insurance. The MCR as you know is a measure medical costs as a percentage of premium revenues received.
UnitedHealthcare Second quarter revenues of $10.3 billion decreased $223 million year-over-year. During the second quarter UnitedHealthcare experienced declines of 150,000 people served through fee-based programs and 260,000 people in risk-based health benefit plans. Membership attrition at continuing clients driven by economic pressures on their organizations was the most significant factor in the decreases, accounting for three-fourths of the total membership decline. The UnitedHealthcare medical care ratio of 84.2 percent was within the range of management expectations, increasing 40 basis points year-over-year, largely due to elevated medical costs related to the H1N1 virus.
UnitedHealthcare
Second quarter revenues of $10.3 billion decreased $223 million year-over-year. During the second quarter UnitedHealthcare experienced declines of 150,000 people served through fee-based programs and 260,000 people in risk-based health benefit plans. Membership attrition at continuing clients driven by economic pressures on their organizations was the most significant factor in the decreases, accounting for three-fourths of the total membership decline.
The UnitedHealthcare medical care ratio of 84.2 percent was within the range of management expectations, increasing 40 basis points year-over-year, largely due to elevated medical costs related to the H1N1 virus.
Ovations (I think this their Medicare Advantage Program and saw a big revenue growth)
Ovations revenues were $8.0 billion in the second quarter, up $928 million or 13 percent year-over-year.
For Medicare Advantage programs, Ovations reported second quarter growth of 45,000 people and year-to-date growth of 245,000 people or 16 percent. Strengthened product design, marketing and distribution and local market engagement drove strong, balanced growth in Medicare Advantage.
Steady growth in active Medicare Supplement products has continued in the second quarter, with Ovations increasing the number of seniors served in this product family by 25,000 to more than 2.6 million people.
AmeriChoice
They also have under the umbrella:
Business Description – Ingenix
Ingenix is a leader in the field of health care information, services and consulting, serving pharmaceutical companies, health insurers and other payers, physicians and other health care providers, large employers and governments. The Ingenix contract revenue backlog increased 22 percent on a year-over-year basis to $2.2 billion at June 30, 2009.
Operating margins went from 12.9% to 14%
Business Description – Prescription Solutions
Prescription Solutions offers a comprehensive array of pharmacy benefit management and specialty pharmacy management services to employer groups, union trusts, seniors and commercial health plans.
Operating margins increased from 3% to 4.7%
This is for all operations including their consulting business.
Health Care Services
OptumHealth
Ingenix
Prescription Solutions
Corporate
Total Consolidated
So what they did was take last years quarterly that had a large corporate write off of (783) which lowered their quarterly earnings and compared this year quarterly earning that didn't have that write off.
Now, this is a site that has a lot of people that deal with numbers. You tell me, ya think the AP was doing good reporting as investment research would require or were they trying to make a good story?
The six month report went this way (including the (783 write down)
First column is this year second is last year.
People Served
People Served
2009
2009
2008
2008
2007
Commercial Risk-based
Commercial Fee-based
Total Commercial
I'm not sure where the big drop off is in people served.
The reports are public information docs and if you think I doctored this ...have a go at it and get the report. This is not what I want to be doing on a nice afteroon. It is long but just glancing I think the person writing the story did not read the segmented financial information.
Here is the most recent 10K and shows 2007 & 2008 net earnings for the years ending:
(in millions, except percentages and per share data)
Consolidated Operating Results
Revenues
Earnings From Operations
Net Earnings
I just don't know? I'm not finding the smoking gun? Maybe I've been away from the business too long to find the smoking gun but there doesn't seem to be a health insurance segment that has had a 200% net earnings increase. They may be seeing something in the Medicare Advantage / Plan D Bush fiasco but in the general health insurance market....?
Let me know if you find it because I've lost the energy to keep looking.
It is in the 8K
Look at the Consolidated Statement of Operations.
Second quarter profits (Three Months Ending June 30).
RebelCapitalist.com - Financial Information for the Rest of Us.
Bob
I was always taught that the Segmented on an 8K was a better snap shot because it contained all the gobbledy gook above it. Personally I like the 10K because it gives a longer view. But using your Consolidated Statement of Operations idea what you will find is that over a three year period of the same quarters
A longer view of the annual 10K report
Consolidated Statement of Operations Net Earnings shows
2002 - $1,352
2003- $1825
2004 - $2587
2006 - $4,159
2007 - $4,654
2008 - $2,977
Segmented Report of net earnings
2002 - $2,935
2003 -$2,186
2006 - $6984
2007 - $7849
2008 - $5263
Do you now understand why I say that the writer has not used good judgment. When I was in the business if I would have prepared a report to lead a client in such a way the NASD (now FINRA) could have had my head.
Some of the newer operations such as the consulting are a profit margin. To remove the consulting and see how well the risk based health care only looks would take a bit more time. They do have a report called Medical Costs.
Medical costs:
2001 - $17,644
2002 18,192
2003 20,714
2004 27,000
Then there are the income taxes
Year Ended December 31, (in millions)
Current Provision
Federal
State and Local
Ok....my eyes are glazing over.
The point is that using what you pointed out shows that in the same quarter of 2007 the Net Earnings under Consolidated Statement of Operations was $1,197 which is higher than the current $859. In the same quarter of 2006 the 8K Consolidated Statement of Operations Net Earnings was $974.
2006 - $974
2007 - $1,197
2008 -$337
2009 - $859
So again I ask, why did the writer decide to compare quarter to quarter against one of the lowest quarters in 4 years?
I have no problem with media nailing someone making obscene profits but when I can quickly see that the writer put things in perspective to prove their point, comparing a down year to a normal year. Well I have a problem with that.
If you want to look some more that's cool. Maybe I am missing something but I don't think so. I don't have time to edit and make sure I have everything in order ....the thunder storm is here gotta go!!!
this is nonsensical at this point
I'm sorry, you're trying to claim something that simply isn't true. ....to the point of trying to cherry pick 8-k and 10-k statements trying to find your belief when you cannot examine these statements like this, it's not valid.
I'm sorry but it's like you are desperate to claim the beyond belief profits don't exist and frankly it's not only been documented in earnings reports but also aggregate studied such as this study, which shows once again a massive increase.
there is no way I'm pouring over 10-k, 8-k statements trying to disprove a that same companies' quarterly and yearly earnings press release, or point out whatever your logic error is, or other studies showing they indeed have increased profits 428% since 2000.
Ya know what.....
I'm done posting on this list. You have acted as a child. I give you the information and you stomp and stomp. Well, in your puffery voice you say....I'm not going to look at that stuff. I have not produced my own propaganda, I have only reproduced what is already on record. Are you afraid that you may find that the world isn't as the propaganda people told you?
So Bob, it has been fun but there are thousands of other blogs out there that are willing to read what people offer. This blog is above DKoz and HuffPo but only by degrees.
So have fun, have a good life and good bye. You don't want dialog, you want propaganda.
BTW
I never said profits don't exist but I did give you the SEC reports. I get the feeling that if you need someone to help you read a 10k or 8K you may not be the bright bulb I thought. Since Wharton is very close to me, I have given them a dollar or two or three of my money for class time. I think I do remember one or two things that they taught me.
Good night!
rebel is right
but an easier to way to do this, although it appears we need JV here to write a tutorial on how to read 10-k and 8-k statements. but the easiest way is to just read the corporate press release and other financial news people who already are pouring over the statements. ;)
Nope
The SEC reports are fairly simple to read, clear concise and meant for the novice to read. That is why they are there. I think I proved that the "financial news" people do always report well. There is no way to turn it, they misrepresented the quarter to quarter compairson. IF they would have given a long term compairson, I would have no problem. It would be like when I has my investment business. I starved for many years, then one year was a great year. So how wrong it would have been for the editor to say..."see his profits tripled compared to last year." Sadly that big, big year never continued and everything turned back into making a regular living. At least the starving years were over. :)
Now, there is no doubt in my mind that there are some bad, bad actors out there that are raking in profits. It also varies by State. In my State of PA there were many years that HMO's were losing money. "The study also indicated that 1997 was the third straight year of decreasing profits for HMOs in Pennsylvania. Weiss Ratings' study also found out that HMOs spent 90.1 cents on every premium dollar on medical expenses in 1997 as well as another 12.8 cents on administrative costs. HMOs are currently enhancing their investments in the stock market to compensate their operating losses."
If I were going to start another business health insurance would be the very last. My friend is a sales rep for a subsidiary of Genuine Parts. They work on a constant 25% profit margin. Look up and see how much they make around the world. Now that is where the money is and there isn't any surplus/reserve requirements or tort lawyers after you.
Profits were more evenly distributed among the 456 HMOs reviewed by Weiss, with an increase in profits seen among the smaller HMOs. During the first three quarters of 2001, 28 of the largest HMOs were responsible for $534.7 million, or 61 percent of the industry's total profits, while 428 mostly smaller plans contributed $344.7 million, or 39 percent to the industry's total bottom line. For the same period in 2000, only 33 HMOs were responsible for an aggregate $1 billion in gains, while 495 companies suffered aggregate losses totaling $158.9 million. "Despite the modest profit decline, the industry actually looks healthier as a larger number of companies increase premiums and consolidate in -- or withdraw from -- unprofitable markets," said Martin D. Weiss, chairman of Weiss Ratings. "Unfortunately, this also means more consumers are being forced to bear the burden of the industry's recovery through rising health care costs and, in many cases, a reduction in coverage options."
Continuing a recent trend, Texas and Michigan HMOs reported the worst earnings. In Texas, 35 plans reported an aggregate loss of $412 million with 23 of the 35 HMOs, or 65.7 percent, reporting red ink. Michigan's 27 plans reported an aggregate loss of $28.2 million, with 12 of the plans, or 44.4 percent, losing money. 2001 "HMO failures are still near the highest level in recent history; and failures among insurers and banks are also on the rise. The best protection is accurate forewarnings." According to Weiss, what you have been seeing in HMO's is the offset of major loses in the 1990's and early 2000's. That doesn't play well in Peoria and I think the HMO's could find a more palatable way to trend their premiums. It will be different in the government plan. Need money to reset the down years, just tax someone or print the money. Easy and done.
Increased profits do not always mean increased premiums. "Humana attributed its profit gain to
said Regina Nethery, vice president of investor relations."
There was a lot of reporting like this in the late 1990's early 2000's: " Coventry Health Care of Kansas, Inc. (Wichita, Kan.) was downgraded to D (Weak) from C- (Fair) due to a progressive decline in earnings. The company reported losses of $1.8 million in 2000, $7.3 million in 2001, and $5.5 million during the first half of 2002. The downgrade also reflects the weak financial ratings of the company's affiliates within the Coventry Health Care, Inc. group. The Health Plan of the Upper Ohio Valley, Inc. (St. Clairsville, Ohio) was downgraded to C (Fair) from B- (Good) due to declines in profitability arising from an increase in health care expenditures. In 1998, the company spent 92.2 cents on medical costs for every dollar of premium received. In 2001, medical costs were eating away at 95 cents of each dollar. The company's risk-adjusted capital ratio remains strong with sufficient funds to cover an unexpected rise in claims."
2002 was the last year I was an RIA. This I am noticing today, the HMO health industry went from low or no profits to more profitable than when I was in the investment business.
Coming from a person that is a doctor, was once an HMO exec., this is an interesting read.
July 23, 2009
Healthcare Policy, Social Justice and Thugs
By John Dale Dunn MD JD
"There is plenty of talk today about the broken medical care system, inefficiency and waste and the prospects of government-planned better quality and how a more accomplished central planning effort and more rules will create better care at a lower price. All the yakking is a distraction. Even the providers, who know the truth, will join the government plan to save, short term, their economic status. Some hope to maneuver a place on the planning committee and receive favorable payment treatment. They also recognize political pressure and know it's a dance; planning doesn't control silly overuse and lack of economic incentives. They know the system will never be sensible until people start paying their own bills for service."
It reminds me of what I heard a professor say at a round table meeting about health care. The moderator asked him, "what has driven us to this point?" The Phd professor said, "people just need to look in the mirror." The guy makes some financial sense but that isn't what people want to hear is it?
if 10-k, 8-k are so easy to read
why do you seem unable to do it in order to deal with what they really say and which has been amplified by their own quarterly earnings reports for years as well as multiple major studies in analyzing costs?
I'm sorry but writing realms of nonsense is getting really ridiculous.
Now you are cherry picking one HMO and finding out some wacked out quote by one guy.
At this point you need to read the EP FAQ. You cannot cherry pick an exception of one HMO or one MD to deny the massive reports and statistics from major studies, done by credible organizations, including the GAO, to try to spin stats to what you wish to believe.
I mean this is really a waste of time, last time you tried to claim a HSA is somehow health insurance!