
I sometimes find it frustrating how the market bulls try to spin the unemployment numbers to "prove" their point. It you only look at headline numbers it sounds convincing, but if you do some digging then the Rosy Scenario falls apart.
I'm going to take apart three major concepts in this essay.
Job Cuts
Green Shooters like to point out the private job cuts report by Challenger, Gray & Christmas Inc., and I admit that it does look impressive.
However, they don't bother to mention the official report that came out just a few days ago.
Employers took 2,763 mass layoff actions in June that resulted in the separation of 279,231 workers, seasonally adjusted, as measured by new filings for unemployment insurance benefits during the month, the Bureau of Labor Statistics of the U.S. Department of Labor reported today. Each action involved at least 50 persons from a single employer. The number of mass layoff events decreased by 170 and associated initial claims decreased by 33,649. Both measures had been at record high levels in May.
It hardly seems like a bottom when mass layoffs are just one month short of all-time highs.
Initial Claims
Green Shooters like to say that a peak in unemployment claims coincides with an end to a recession.
This so-called peak in initial unemployment claims is deceptive on many different levels.
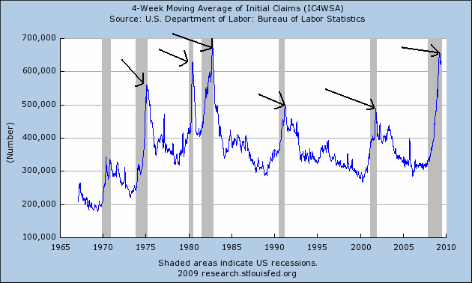
1) The most obvious way is that if you look back at previous recessions you'll see several instances of temporary "false peaks". Thus there is no guarantee that the recent "peak" isn't a "false peak".
For example, some Green Shooters were so eager to call a top that they were claiming back in March, 2009 that initial claims had peaked, as well as in November 2008.
2) The biggest lie to this initial claims peak involves the fact that the peak doesn't really exist. The fact is that the initial claims numbers are seasonally adjusted, and that seasonal adjustment has distorted the picture.
Claims for state unemployment benefits fell sharply in the latest weekly data, after seasonal adjustment, the government reported Thursday, but problems with the data due to the timing of layoffs mean that recent drops may not represent economic green shoots.But the data are "clouded" because many of the expected temporary layoffs in the automotive sector have already occurred, a Labor Department analyst said Thursday.
"We expect a hefty rebound over the next few weeks," wrote Ian Shepherdson, chief U.S. economist with High Frequency Economics, in a research note. "The latest numbers are just far too good to be true...It is not good news, especially for the people concerned."
The government seasonally adjusts the data, assuming that auto layoffs will take place in early July. But many manufacturing layoffs, predominantly automotive, have already occurred, while others may come later or not at all.
Those auto industry layoffs happened earlier in the year, causing a higher peak a few months ago, but also creating a false drop in recent weeks.
What's more, those layoffs, which in the past would have been temporary and season, are mostly permanent now because of the bankruptcies of Chrysler and GM.
Because the seasonal data will expect more hiring in the fall in the auto industry than what will occur, the seasonal adjustments will show another spike in the near future.
Continuing Claims
Finally we come to the most deceptive of all the Green Shooter lies about unemployment. They like to show this chart, which appears to show a drop in people collecting unemployment insurance.
This chart is a bald-faced lie.
To prove that I want to show you a different chart.
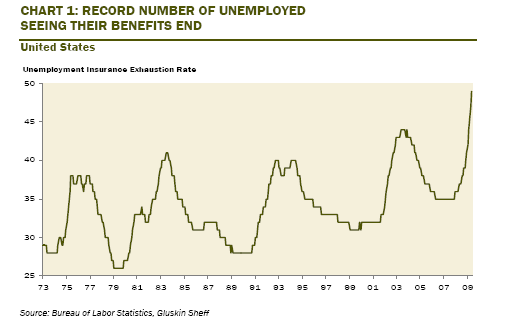
I want to introduce you to the "exhaustion rate", which you can find here.
500,000 people will exhaust their state unemployment benefits by September without finding a job, and thus drop off the official continuing claims numbers. Because of Obama's stimulus bill, they will get picked up by the federal Emergency Unemployment Compensation, but that is under-reported separately.
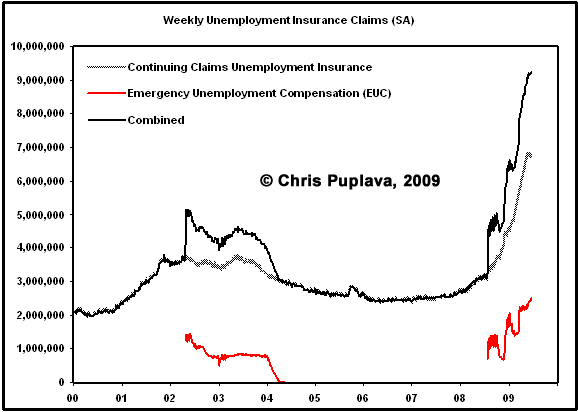
If you look at the combination of the two programs you will absolutely not see a top in unemployment continuing claims.
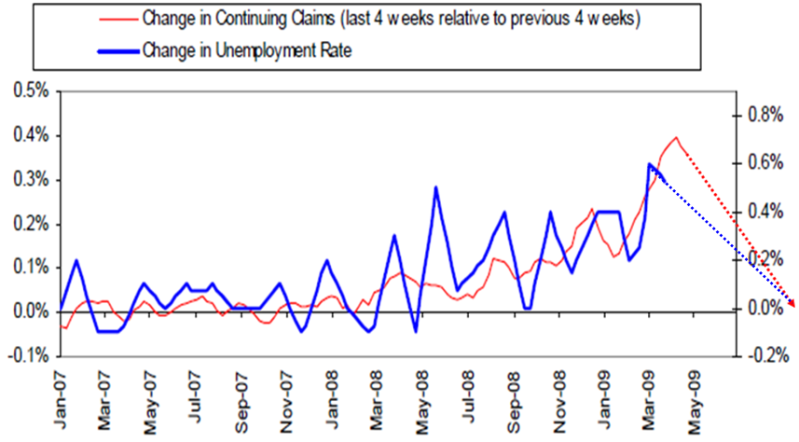
No matter how people try to spin things, the reality is that the first step in any recovery is that businesses will give their workers more hours.
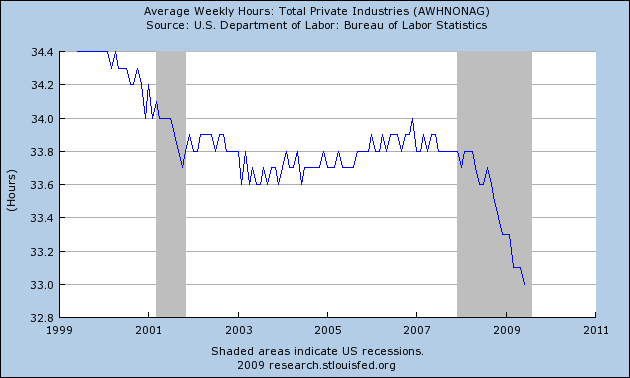
As the chart clearly shows, businesses are still slashing hours. Until that ends there will be no hiring, and until there is hiring the unemployment rate will continue to rise.
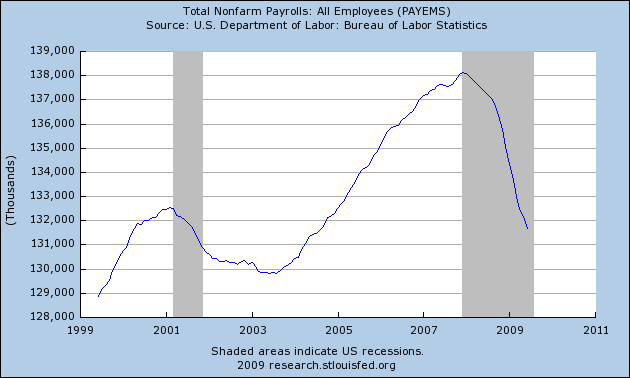
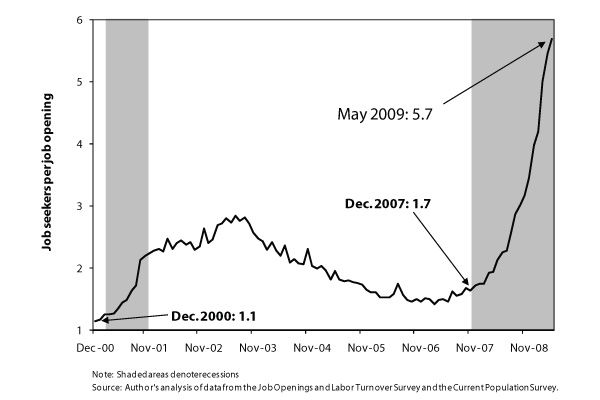
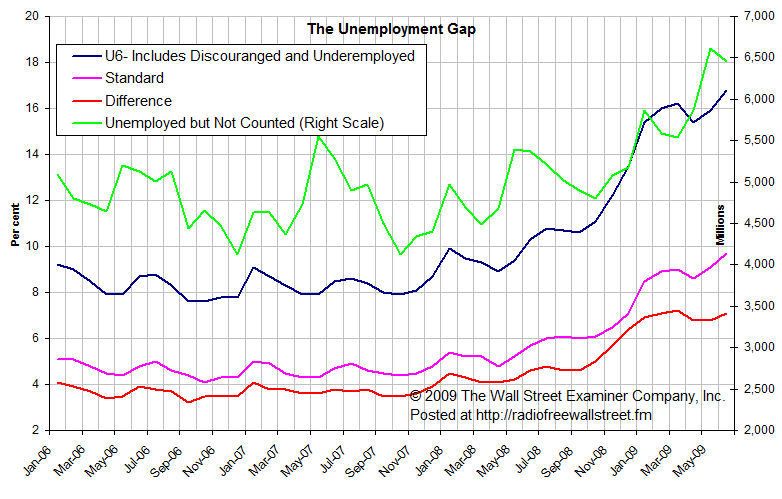
Finally I want to throw in a couple other unemployment charts that Green Shooters aren't talking about because they contradict their spin.
Comments
I think the term recovery is seriously abused
it should be "determining a bottom" but in my view they cannot call this a recovery until GDP grows past what is needed to maintain the status quo, which is roughly (and this is another issue I plan on writing about, the components of GDP) but for now, roughly about 1.5%.
So, my argument has been a bottom is not recovery. A slower contraction is not growth.
But, midtowng, you are going to feel very validated.
The Atlanta Fed (who run a very cool blog, so let's not blast all of the Fed for it's really outstanding frankly) post from today shows this time the unemployment rate is an anomaly from past recessions. So, using past predictors isn't quite working.
See the actual post, it's very good but here is their graph (click to enlarge):
Added a few more charts
Those Bonddad diaries at the Big Orange drive me up the wall. People that don't understand the numbers, or that don't spend the time breaking the numbers down like I do, are taken in by his charts.
In fact what is going on is a f*ckin disaster, and people need to know. The sooner the better.
I have to wonder why people aren't out in the street with torches and pitchforks already.
I will give you 3 reasons why no torches and pitchforks
1) People don't understand what is going on.
2) Massive disinformation by media and politicians in order to prevent civil unrest.
3) People are in denial about how bad the situation is.
I believe a case can be made for all three.
There are two things that are absolutely frustrating to me:
1)Look at a headline story such as the one on Bloomberg right now: "Economy in U.S. Probably Shrank at a Slower Pace, Signaling Recession Abated". Most people read headlines and not the whole story.
2) Our economy and society as a whole is not prepared for the long-term structural unemployment that we are heading for and the time is now to start preparing for that. Unfortunately, we don't have the political leadership or will to make the necessary changes.
RebelCapitalist.com - Financial Information for the Rest of Us.
Another reason
We simply have too much to entertain us and are thus lazy. Back when people took to the streets they didn't have tv, the internet, dvr's, dvd's, etc. and were thus much more linked to reality than people are now.
My guess is that unemployment will be extended again sometime this fall, when it becomes very apparent that there will be no jobs created during the aftermath of this recession.
Americans are lazy?
Are you frickin' kidding me? Americans are .....<fill in some blame the victim crap here>?
We have the longest hours, the least amount of leisure time, the best universities of any industrialized nation.
Lazy in regards to protesting
You have essentially made my point. When most Americans get free time, they sure don't spend it protesting. We simply have too many toys to distract us.
I will agree with that one 10 fold
One of my "issues" surrounds professional labor and getting these people to organize, hell you cannot even get them to write a semi-comprehensible blog post on some of the facts...getting them to organize or physically show up and plain protest...they won't even pay dues to join a union or even a professional society.
It's just unreal, it's only their economic lives that are on the line.
I was going to include
this, but I wasn't 100% sure that I fully understood it, of believed it.
It certainly sounds interesting though.
they exhaust their unemployment benefits
thus are no longer counted in the statistics. They also do not count occupational "down grade", i.e. someone has a PhD in Chemical engineering yet is working at the Wal-mart. Then that person is counted as employed and is "unskilled labor".
They also count guest workers which artificially deflate the real unemployment rates of Americans. i.e. a division is fired and replaced with H-1Bs. Those H-1Bs are counted in the employment stats making the occupational employment rates of software engineers look less than what they really are.
So, I read his post and I found that a good way of looking at it. For example, in engineering, one would see a very low unemployment rate, yet the total number of jobs in that field dropped by a good 500k. Well, what happened is those jobs were offshore outsourced and people were forced out of their career areas...
So, I think it's valid to look at the different stats to get a more complete picture.
Remember
College when different schools compared enrollment not by the total number of students they had, but by the full time equivalent. (FTE)
Which meant that if a school had 20,000 students going half time, it had 10,000 FTE. A school that had 10,000 students going full time and another 5,000 going half time had 12,500 FTE.
Looking at raw enrollment would be misleading, because it was a bad metric for the amount of education going on.
Maybe it's time that we had a similar measure for work. If we take the purpose of work to be providing individuals the means to support themselves independent of external aid, then a good measure of work would discount underemployment.
How to create this? No idea, but it seems like the concept needs to be given a go of it. A rough measure would look income of the employed to get an idea of the number of good jobs.
additional
They need to calculate the drop in revenues, gross income, income for the self-employed and then track on citizenship as well as training vs. occupational area.
I don't have them on hand but I know I've seen Academic papers discussing BLS shortcomings, esp. with employment stats and proposals to improve it but don't have any offhand.
Nicely done ...
...midtowng.
There's another group that's not being included in this green shoots propaganda: people who are being furloughed. My wife faces 27 such furlough days in the next 12 months, almost six weeks of pay cuts. While, arguably, she'll be picked up (in the aggregate) by U6 stats), the impact of these widespread furloughs are still undercounted, imo.
That's why I included
the average weekly hours worked. It sort of has the same implications as capacity utilization, but more directly effects workers.
My brother is getting furloughed 3 days a month, and it will probably be 4 days a month before everything gets done.
Unemployment Level Maps by State
I've created some interactive unemployment level heat maps for each state. Check out this one for California:
http://www.localetrends.com/st/ca_california_unemployment.php
and this map for Florida Unemployment:
http://www.localetrends.com/st/fl_florida_unemployment.php
my sister - pay cut from 15 to 12/ hr. AND
her employer is no longer paying the 250 a month on her completely CRAP 'health' insurance, AND, her hours got cut from 40 to 30 hours a week.
I so despise the fascists running htis country, but, even worse, are the pathetic sack of shit dems who suck up billions of dollars to be losers to the fascists.
rmm.