
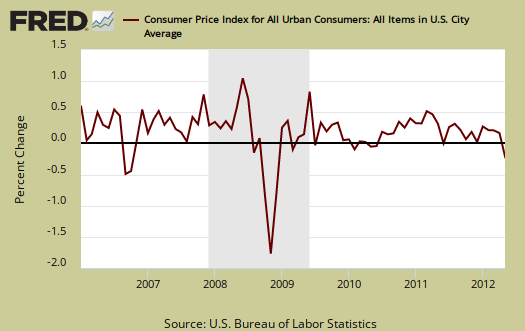
The May Consumer Price Index, which measures inflation, declined -0.3% from April. The reason was gasoline prices, which plunged a whopping -6.8% from last month Below is the graph for CPI's monthly percentage change.
Energy overall decreased -4.3%. The BLS separates out all energy costs and puts them together into one index. Energy is also mixed in with other indexes, such as heating oil for the housing index and gas for the transportation index. The energy index is down -3.9% for the last 12 months. Fuel oil, not seasonally adjusted, decreased -2.8% for the month.
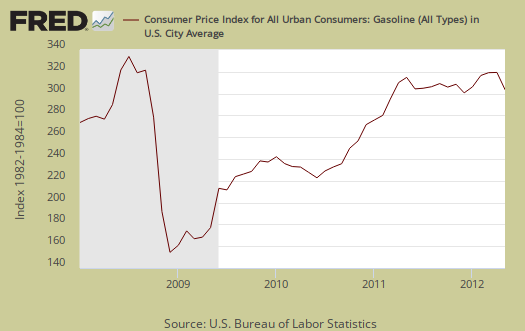
The gasoline index alone decreased -6.8% for May, but is down -4.0% from this time last year. This figure is seasonally adjusted. Boy, you couldn't prove that one to people on the West Coast, where gas prices have been 50¢ higher on average. Graphed below is the CPI gas index.
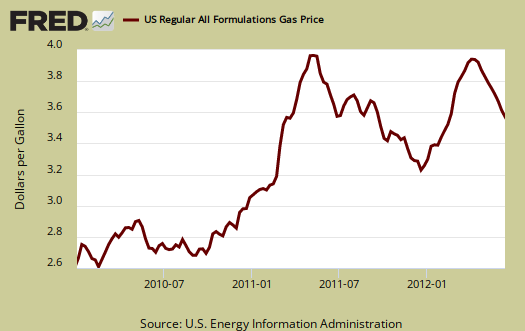
Below are gas prices, last updated June 11th and bear in mind the CPI percentages are for May.
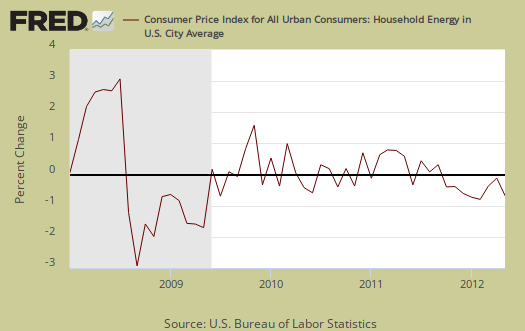
Piped natural gas declined -4.1% for the month and is down -14.9% for the year. All hail fracking? Electricity increased +0.3% and from a year ago, electricity has increased 0.2% and natural gas. Graphed below is the household energy index which includes electricity and natural gas, shown by monthly percentage change. This month the index decreased -1.0%. This is a different, special index to show the overall costs for energy into your home.
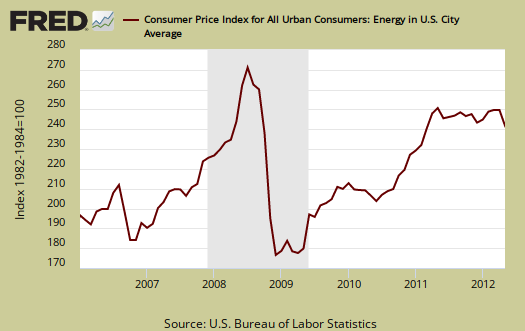
Below is the overall CPI energy index, it's all things energy.
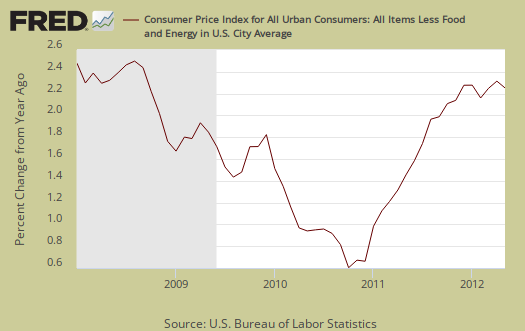
Core inflation, or CPI minus food and energy, increased 0.2% for May. Core inflation has risen 2.3% for the year. Core CPI is one of the Federal Reserve inflation watch numbers. In the graphs below one can see core inflation has been tame and steady.
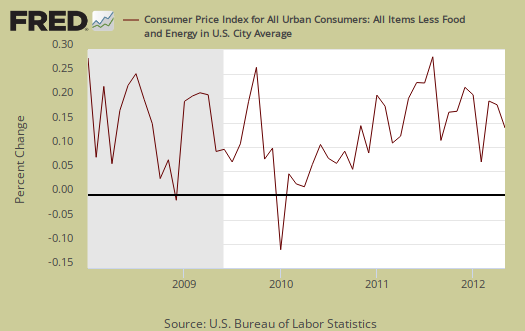
Core CPI's monthly percentage change is graphed below.
Shelter increased 0.2%, the 8th month in a row and is up 2.3% for the year. Rent increased 0.2%, home owner's equivalent rent increased 0.2%. Used cars & trucks increased 1.0% and is up 3.5% from a year ago. New cars increased 0.2% and are up 1.6% for the year. Apparel from a year ago, increased 4.4% and is up 0.4% for the month.
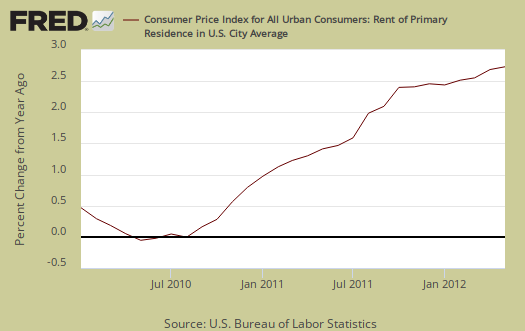
Graphed below is the percentage change from a year ago of rent, the largest monthly household expense for people who can least afford increases as those with less money disproportionately rent vs. own. Rent increased 0.2% for the month.
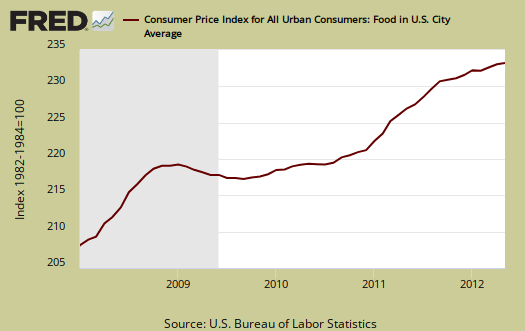
Food and beverages overall had no change for May, but have increased 2.8% from a year ago. The food at home index (think groceries), decreased -0.1% and is up 2.7% for the year. Fruits & veggies increased 0.4%, while meats decreased -0.5%.
Eating out, or food away from home increased 0.2% from last month and is up 2.9% from a year ago.
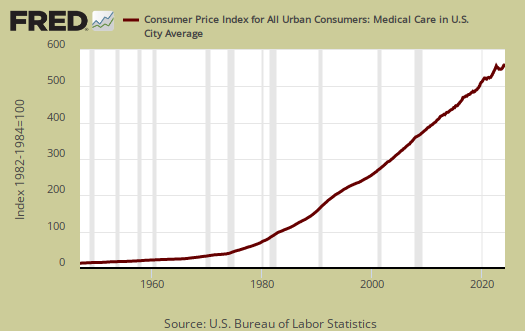
The Medical care index increased 0.4%, the largest monthly increase since November, with the hospital index increasing 0.6% and Doctor fees increased 0.2% for the month. Medical commodities are things like your prescription drugs and did not change from last month.
According to the BLS, food and beverages, which includes food at home, makes up 15.1% of the index. Housing is 41.5% and transportation, including gas for the car, is 17.6%. Medical care is only 7%, they claim. All items minus food and energy are considered 75.4% of the total price expenditures for consumers.
The DOL/BLS does take yearly surveys on where the money goes in the monthly budget, but as one can see, food and energy are significant amounts of the monthly finances. Run away costs in these two areas can break the bank, so can food. Additionally CPI uses substitution, so if steak goes through the roof, somehow we're all just fine with hamburger and prices didn't really overall increase much.
CPI-W for the month, unadjusted was 226.6, a 1.6% increase for the year, but down -0.2% for the month, although not seasonally adjusted. CPI-W is used to calculate government transfer payments, such as social security increases.
Last month's CPI report overview, unrevised, although most graphs are updated, is here.
If you're wondering why the graphs look weird, the graph calculates percentages from the index and doesn't round. The actual data from the BLS report does round to one decimal place. In other words, 0.05% is rounded to 0.1%.
Recent comments