
The Federal Reserve Industrial Production & Capacity Utilization report declined -0.5% for February on mining and utilities. More ominous is an annual -1.0% decline. January was revised to a 0.8% monthly increase. The G.17 industrial production statistical release is also known as output for factories and mines.
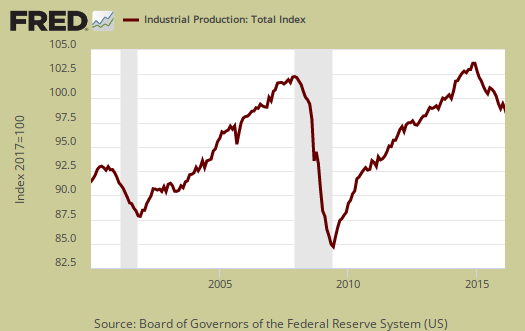
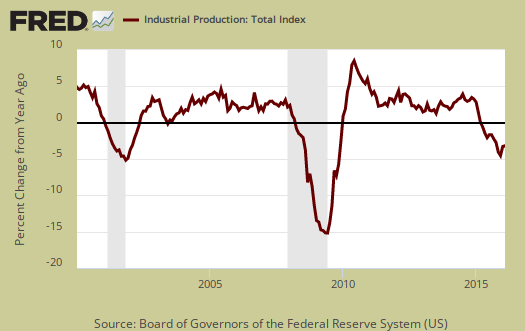
Total industrial production has now decreased -1.0% from a year ago. Currently industrial production is now 6.3 percentage points above the 2012 average. Below is graph of overall industrial production's percent change from a year ago. Notice the grey recession bars in the FRED graph and how closely industrial production follows those bars.
Here are the major industry groups industrial production percentage changes from a year ago. The percentages for mining and utilities are now just horrific.
- Manufacturing: +1.8%
- Mining: -9.9%
- Utilities: -9.3%
For the month manufacturing overall increased by 0.2%. Manufacturing output is 6.4 percentage points above its 2012 Levels and is shown in the below graph.
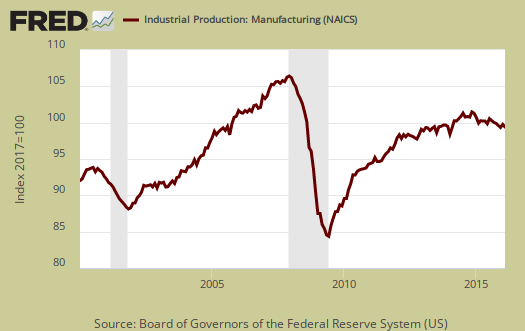
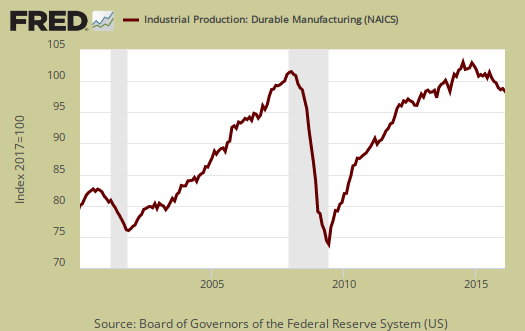
Within manufacturing, durable goods was the good news, with a 0.4% monthly increase. Machinery, primary metals, and miscellaneous manufacturing all had almost 1.0% percentage point gains with wood products losing -1.2 percentage points.
Nondurable goods manufacturing declined by -0.1 percentage points for the month.

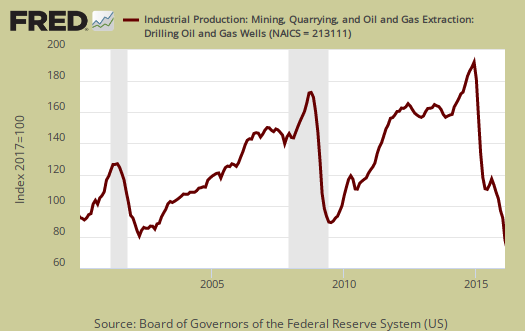
Mining decreased -1.4% and is now down -9.9% for the year. Mining includes gas and electricity production and the Fed have a special aggregate index for oil and gas well drilling. Oil and gas well drilling decreased -15.6% for the month and for the year is down -59.7%.
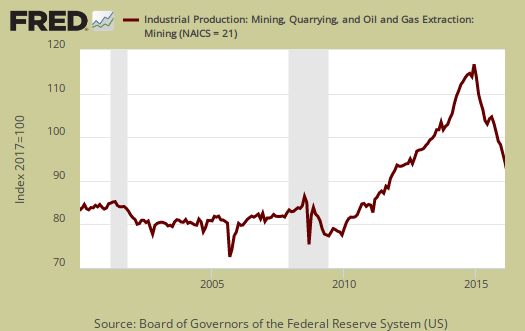
Below is oil and gas well drilling and one can see the boom and bust cycle with the amazing downturn now.
Utilities decreased by -4.0% for the month on warm weather and is down -9.3% for the year. Utilities are volatile due to weather and why the below graph shows the wild swings.

There are two reporting methodologies in the industrial production statistical release, market groups and industry groups. Market groups is output bundled together by market categories, such as business equipment or consumer goods and shown below:
The drop in utilities output for February contributed substantially to declines in the indexes for consumer goods, business supplies, and materials through their energy components. The market groups unaffected by the drop in utilities recorded mixed results. The production of consumer durables rose 0.3 percent; the output of consumer non-energy nondurables decreased 0.5 percent after jumping 1.1 percent in January. In February, the production of business equipment advanced 0.6 percent, with a decrease for transit equipment but sizable increases for information processing equipment and for industrial and other equipment. The indexes for construction supplies, for defense and space equipment, and for general business supplies (non-energy) each rose 0.5 percent or less. The output of durable materials moved up 0.2 percent; the output of nondurable materials moved down a similar amount, primarily because of a drop of 1.5 percent for textiles and a decrease of 0.3 percent for chemicals.
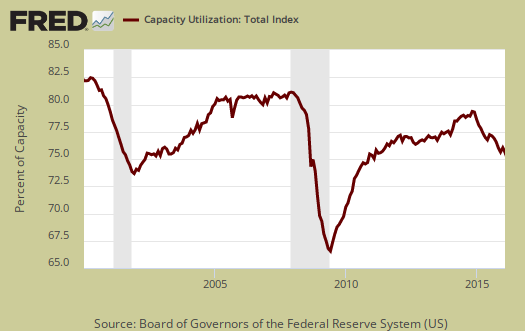
Capacity utilization, or of raw capacity, how much is being used, for total industry is 76.7%, an decrease of -0.4 percentage points from last month. . Capacity utilization has decreased by -1.4 percentage points from a year ago and is 3.3 percentage points below the long run average. This is another canary in the coal mine of not good results. Manufacturing capacity utilization had no change for the month, is 76.1% and is 2.4 percentage points below it's long run average. Mining capacity utilization is 77.5% and has declined 14.4 percentage points from just a year ago. Utilities use of it's capacity is 74.8%.
Capacity utilization is how much can we make vs. how much are we currently using, of what capacity is available now, or output rate. Capacity utilization is also called the operating rate. Capacity utilization is industrial production divided by raw capacity.
Capacity growth is raw capacity and not to be confused what what is being utilized. Instead, this is the actual growth or potential to produce. Capacity is the overall level of plants, production facilities, and ability to make stuff, that we currently have in the United States. Capacity growth overall has increased 1.3 percentage points from a year ago. Below is the capacity growth increase from a year ago of the subcategories which make up industrial production.
- Manufacturing: +1.2%
- Mining: +2.2%
- Utilities: +0.7%
Below is the Manufacturing capacity utilization graph, normalized to 2007 raw capacity levels, going back to the 1990's. Pay particular attention to the 2001-2003 time frame as manufacturing had a mass exodus to China after passage of the bad trade deal in 2000.

This report is showing how dependent the economy is on oil and gas productions. While low gas prices are great for consumers, on the production side of the equation, there are a lot of workers probably without jobs and businesses going a little bust by now. The decline in capacity utilization is this report's real coal mine economic canary. The other thing to take in is how closely all of the graphs of industrial production and capacity utilization follow the recession bars in grey. While this is in part due to an oil and gas bust, it's also become the worst bust in recent times and could be foreshadowing something bigger.
Here are our previous overviews, only graphs revised. The Federal Reserve releases detailed tables for more data, metrics not mentioned in this overview.
Recent comments