
The Federal Reserve's Industrial Production & Capacity Utilization report shows a +0.4% increase for December 2011 Industrial Production. This report is also known as output for factories and mines. Manufacturing alone jumped +0.9%. November's industrial production was revised downward to a -0.3% decrease.

Utilities increased -2.7% in December and the Fed blames warm weather causing a demand decline. Mining industrial production increased +0.3%. Motor Vehicles & Parts increased 0.6% for the month. Business equipment increased +0.8% for December.

Total Industrial production is still down -4.7% from pre-recession levels, in other words going on 4 years, even while up +2.9% from December 2010. The Fed also reports capacity utilization, is -2.3 percentage points below the entire 1972-2010 average, but is up 2.0 percentage points from a year earlier.
Below is the Fed's description of Market groups from the report and their monthly percent changes.
The production of consumer goods gained 0.2 percent in December and moved up at an annual rate of 1.1 percent in the fourth quarter. The output of consumer durable goods rose 0.3 percent in December, with increases in the indexes for automotive products, home electronics, and miscellaneous consumer durables partially offset by a decline in the index for appliances, furniture, and carpeting. The output of nondurable consumer goods rose 0.2 percent, but the index declined at an annual rate of 0.7 percent for the fourth quarter. In December, the production of non-energy nondurables advanced 0.7 percent, with gains in all of its component indexes other than clothing, while the output of consumer energy products decreased 1.0 percent.
The output of business equipment rose 0.8 percent in December. Increases of more than 1 percent were recorded by the indexes for information processing equipment and for industrial and other equipment, but the index for transit equipment decreased 1.0 percent. In the fourth quarter, the production of business equipment rose at an annual rate of 10.0 percent, in part because of a jump of 23.3 percent in the production of transit equipment. The gain in business equipment this past quarter was similar to the average pace of increase over the past two years.
The production of defense and space equipment fell 1.3 percent in December but advanced at an annual rate of 6.1 percent in the fourth quarter.
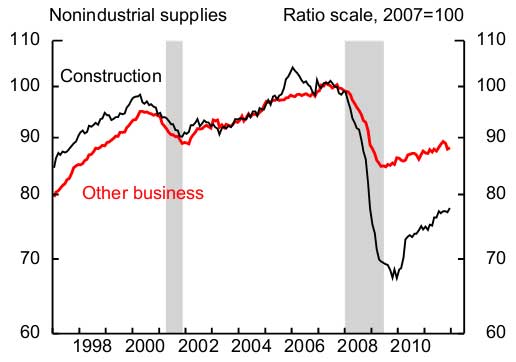
Among nonindustrial supplies, the production index for construction supplies increased 1.0 percent in December. The output of construction supplies rose at an annual rate of 1.2 percent in the fourth quarter, its eighth consecutive quarterly gain. Nevertheless, the index remained more than 20 percent below its level preceding the recent recession. The production of business supplies increased 0.3 percent in December but fell at an annual rate of 1.9 percent for the quarter as a whole.
The production of materials rose 0.6 percent in December. The index advanced at an annual rate of 3.9 percent in the fourth quarter after having climbed 6.7 percent in the third quarter. The production of durable materials jumped 1.6 percent in December, with gains for all of its major components. The output of nondurable materials rose 1.0 percent, with large increases in the output of textiles and chemicals slightly offset by a decline in the output of paper. The index for energy materials fell 0.6 percent but moved up at an annual rate of 2.5 percent in the fourth quarter.
Below is the industrial production graph for construction, in black, where we can see this entire sector is still decimated after the housing bubble burst and is over 20% below pre-recession levels. Construction supplies increased 1.0% this month and are up 4.6% since December 2010.
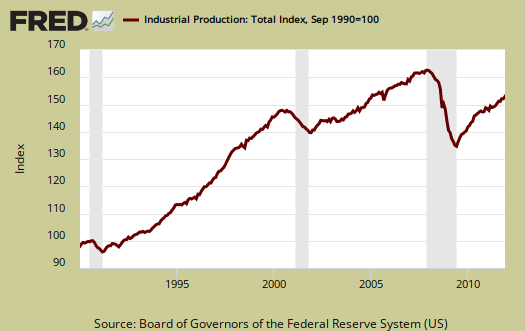
Below is another graph of industrial production since September 1990, indexed to that month. Look at the slope, the growth through the 1990's and then compare to 2000 decade. It was in 2000 when the China trade agreement kicked in and labor arbitrage of engineers, advanced R&D, I.T., STEM started in earnest.
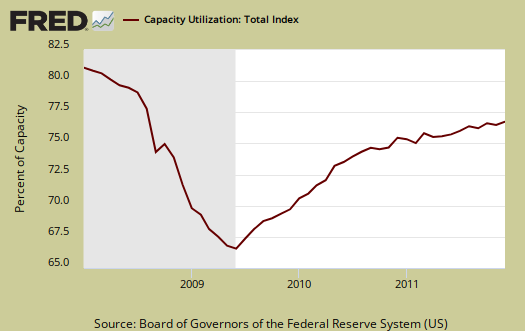
Capacity utilization, or of raw capacity, how much is being used, for total industry is now 78.1%, up 0.3 percentage points from last month. This is -2.3 percentage points below the average from 1972 to 2010, 80.4%.
In December, capacity utilization rates at industries grouped by stage of process were as follows: For the crude stage, the operating rate edged up 0.2 percentage point to 90.4 percent, a rate that was 4.0 percentage points above its long-run average; for the primary and semifinished stages, utilization increased 0.3 percentage point to 74.8 percent, a rate 6.5 percentage points below its long-run average; and for the finished stage, the operating rate increased 0.3 percentage point to 76.9 percent, a rate 0.4 percentage point below its long-run average.
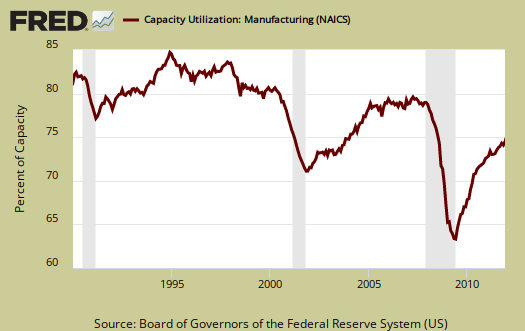
According to the report, manufacturing uses 77.8% of capacity, utilities 10.4% and mining 11.8%.
Below is the Manufacturing capacity utilization graph, normalized to 2007 raw capacity levels, going back to the 1990's. Too often the focus is on the monthly percent change, so it's important to compare capacity utilization to pre-recession levels and also when the economy was more humming.
This overview was truncated due to it's late date publication. The Federal Reserve releases detailed tables for more data, metrics not mentioned in this overview.
Here is our industrial production report overview from last month, unrevised.
manufacturing capacity
I normally create capacity graphs but due to the SOPA/PIPA did not this month due to playing catch up. But the AAM did and you should check out their manufacturing capacity graph.