
 The Advance Retail and Food Services Sales Report for May (pdf) from the Census Bureau showed that seasonally adjusted retail sales were at $421.147 billion in May, 0.6% higher than April's $418.840 billion and 4.3% higher than year ago sales of $403.728 billion, in figures that are not adjusted for inflation; actual sales for May, from which the headline number was derived, were at $444.122 billion, up from actual April sales of $414.705 billion, as purchases of most items, even food, typically increases seasonally from May to April.
These aggregate sales numbers are derived from questionnaires mailed or faxed to a probability sample of less than 5000 firms selected from the universe of 3 million retail and food services firms; and had a margin of error of ±0.5% for May's figures; which means that Census is 90% confident that the seasonally adjusted change in sales from April to May was between 0.1% and 1.1%, so keep that in mind as we examine these apparently exact sales numbers.
The overall increase in sales from April to May was led by a 1.8% increase in sales at car dealers, from a seasonally adjusted $77.675 billion in April to $79.083 billion in May, a total 8.5% higher than the $72.886 billion sales of a year ago; without those car sales, retail sales were only up 0.3% for the month...Other major monthly percentage gains were registered by building material & garden supply stores, whose seasonally adjusted sales rose nine-tenths of a percent, from $26.158 billion in April to $26.387 billion in May, food & beverage stores, where sales rose 0.7% from $47.822 billion in April to $48.173 billion, non store retailers (mostly online), whose $37.330 billion of May sales were 0.7% higher than April's, and miscellaneous store retailers, whose sales total of $10.601 billion was 1.2% higher than April's. Retailers who saw sales decline in May included furniture stores, where seasonally adjusted May sales of $8.131 billion were 0.8% less than April's $8.197 billion, restaurants and bars, where May sales declined 0.4% to $45.928 billion, electronic and appliance stores, where May's sales of $8.380 billion were also off 0.4% from April's $8.412 billion, and department stores, where May sales were off 0.2% to $14.713 billion.
Seasonally adjusted month over month percentage gains for these and all types of retailers can be seen on the above table from the report, which also shows the sales percentage gain from May of last year; as you can see, only nonstore, online retailers, who saw sales increase 11.3% from last year, and building & garden supply stores, who sales were up 10.1%, posted double digit year over year gains...meanwhile, year over year sales declined 0.5% at furniture stores and electronic and appliance stores, and 3.9% at department stores (not including their leased departments).
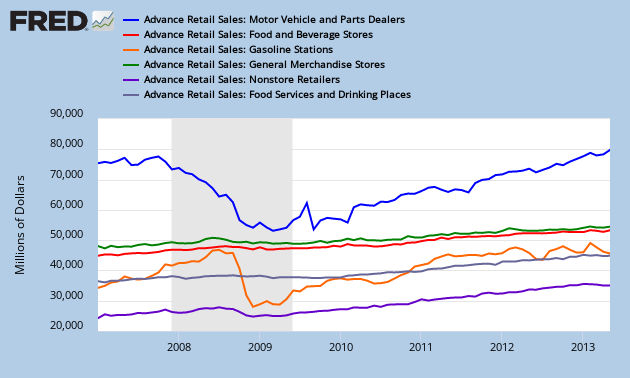
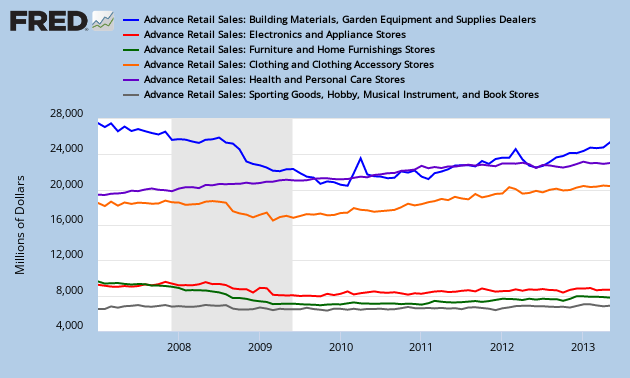
Below we have two FRED graphs which show the track of each of these major retail groups since the beginning of 2007, a date selected to show some of the prerecession sales trend for each....the first FRED graph shows seasonally adjusted monthly sales for motor vehicle & parts dealers in blue, sales for food & beverage stores in red, gasoline station sales in orange, sales at general merchandise stores in green, non-store, or online sales in violet. and sales at bars and restaurants in grey...you'll easily note the collapse in aggregate auto sales, which was recession related, whereas the near halving of gasoline station sales resulted from a rapid fall of the price of gas from over $4 a gallon to below $1.90 nationally...before we look at the second FRED graph below, note the difference in the scale on the left of each graph; the first graph covers sectors with monthly sales amounts from $20 billion to $80 billion, while the second graph tracks sales of retail groups with monthly sales between $4 billion and $28 billion (click either for a larger view)...the second FRED graph shows seasonally adjusted monthly sales at building & garden supply retailers in blue, electronics and appliance store sales in red, furniture stores in green, clothing stores in orange, drug stores in violet, and stores specializing in sporting goods, hobbies, books or music in grey...remember, these seasonally adjusted sales amounts are not adjusted for inflation, so the apparent uptrend in any category may just reflect higher prices and not more unit sales...by rights, May's sales gains should also be adjusted for inflation using the CPI, but the CPI for May will not be released until Monday…
With this May report, the basis for these monthly sales estimates were revised for the first time in two and half year to reflect the introduction of a new probability sample, based in part on the results of the 2011 Annual Retail Trade Survey; details on reliability of estimates for each kind of business are included at the end of the report (pdf)...as we mentioned, May's overall sales figures had a margin of error of ±0.5% and are subject to revision..in a special report, Doug Short looked at the differences between the monthly advance estimate, which we have just covered, and the third estimate, released two months later, over the period from 2007 until the most recent 3rd revision; he found that over this period, there were 33 upward revisions and 41 downward revisions, with an average revision of 0.38%; the average upward adjustment was 0.30%, and the average downward adjustment was -0.44%...for a visualization, see the chart he developed showing the dollar value of those revisions in millions...
Comments
nice find on the survey sample size for retail sales
Good God that's small for a survey. I would suggest a few things here, first use the seasonally adjusted figures. For May, the increase is 0.6%, for April, 0.1%. Second, do not hotlink pdfs. Your page won't load, it's not a good idea for blogs.
it is seasonally adjusted..
all the data i used was from the seasonally adjusted side of the table...it was only in the opening paragraph where i gave unadjusted sales, to contrast the difference...
pdfs open in in the same window as the post theyre linked in with both browsers that i'm using; internet explorer and chrome; i never realized there might be a problem...
rjs
just formatting
The best page load is to upload your images here, make them the right size and of type JPEG. Also, in FRED, it's best to resize the graph via the FRED system first, the dimensions here are 525px width, 315px height.
Very glad you reviewed this, generally speaking now that I look at the data, there is nothing to write home about here and why Wall Street would be happy with this is beyond me.
We'll c with real and there is a correlation to this report and consumer spending. Ran those results a while ago.