
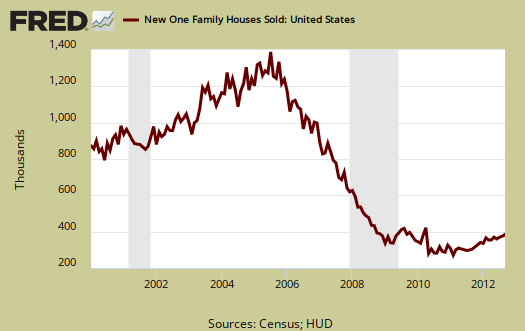
September New Residential Single Family Home Sales increased 5.7%, or 389,000 annualized sales. June through August were all revised. August's single family new home sales were revised from 373 thousand to 368 thousand homes sold, which is a -1.3% decline instead of the -0.3% originally reported. June is now a -2.4% drop from May, or 360,000 homes and July now shows a 3.6% increase to 373,000. The September monthly percentage change has a ±14.8% error margin and this is why we see large revisions to new home sales figures. Don't get too attached or excited over the monthly percentage changes for odds are they will be revised.
New single family home sales are now 27.1% above September 2011 levels, but this figure has a ±19.3% margin of error. A year ago new home sales were 306,000. Sales figures are annualized and represent what the yearly volume would be if just that month's rate were applied to the entire year. These figures are seasonally adjusted as well.
The midwest region saw a monthly new home sales drop of -37.3% and for the year have declined -31.9%, outside the yearly ±28.6% margin of error.
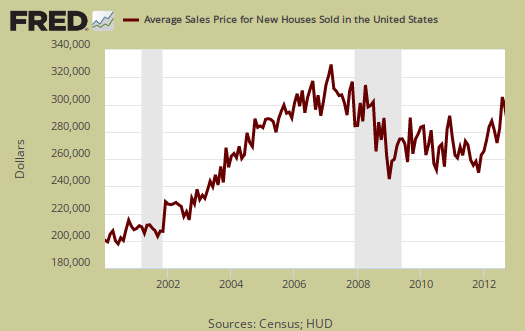
The average home sale price was $292,400, which is basically no change, a -0.5% drop from last month's average price of $293,900.
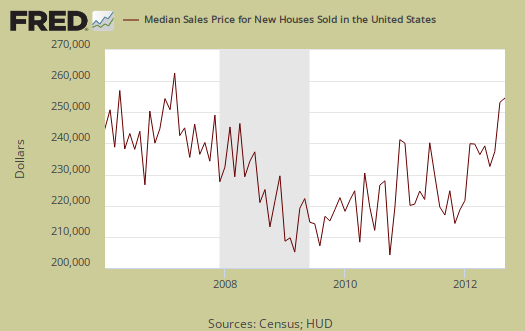
September's median price dropped -3.2%, from $250,400 to $242,400. Median means half of new homes were sold below this price and both the average and median sales price for single family homes is not seasonally adjusted.
Inventories are really tight. The current supply of new homes on the market would now take 4.5 months to sell. This is a -4.3% drop from last month's revised inventory figures. The amount of new homes for sale was 145,000 units, annualized and seasonally adjusted. From a year ago housing inventory has declined -28.6% and is above the margin of error of ±12.5%.

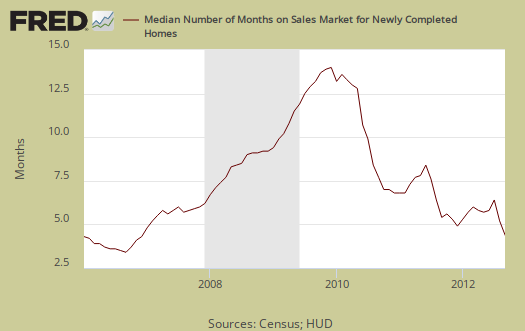
Below is a graph of the months it would take to sell the new homes on the market at each month's sales rate. We can see these inventories vs. sales times have dropped dramatically from a year ago.

The median time a house was completed and on the market for sale to the time it sold was 6.5 months, a dramatic drop of 22.6% in comparison to August's 8.4 months.
The variance in monthly housing sales statistics is so large, in part, due to the actual volume declining, along with the fact this is a survey. One needs to look at least a quarter to get a real feel for new home sales, but a year of sales data is more in order. Additionally this report, due to it's huge margin of error, is almost always revised significantly the next month. Buyer beware on month to month comparisons and reacting to primarily figures and why we graph up the statistics so one can identify a real trend versus press headline buzz.
What we know about new homes sales are increasing from the year ago change. We also see new single family home prices being out of reach for most families by income. We list the margins of error for they are usually above the monthly reported percentage changes. The Census notes that the average revision is about 5% of the original reported.
Here is last month's new home sales overview, only graphs revised.
Recent comments