
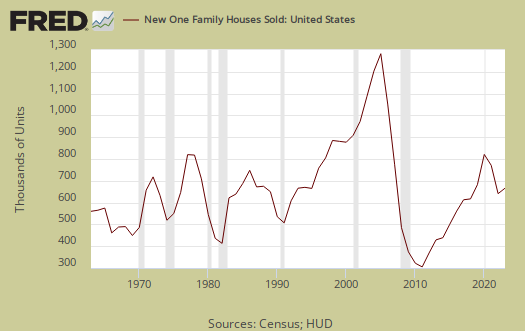
In January, New Residential Single Family Home Sales decreased by -0.9%, or 321,000 annualized sales. This report has a ±16.6% monthly margin of error. December single family home sales were significantly revised, from 307,0000 to 324,000 new homes, a +5.4% revision. New single family home sales are now 3.5% above January 2011 levels. January 2011 saw 310,000 new home sales. Sales figures are annualized and represent what the yearly volume would be if just that month's rate were applied to the entire year.

New Home Sales for all of 2011, were at a record low of 304,000 units, going all the way back to 1963. Below is a graph of the annual new home sales.
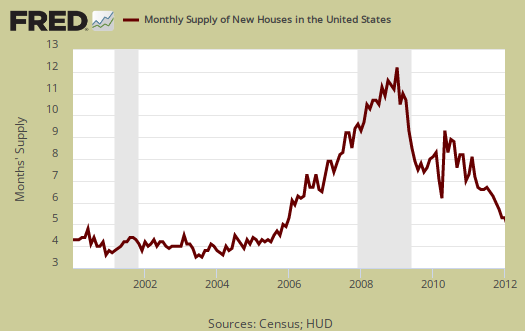
The supply of new homes for sale, are now at 5.6 months, assuming current sales rates. The amount of new homes for sale was 151,000 units, annualized and seasonally adjusted. Below is a graph of the months to sell new homes on the market at each month's sales rate. We can see these inventories vs. sales times have dropped dramatically, but at still at housing crash bubble time levels to sell them all.
The median time a house was for sale increased to 7.1 months from 6.8 months. Below is a graph of the median time it took to sell the homes sold in January.

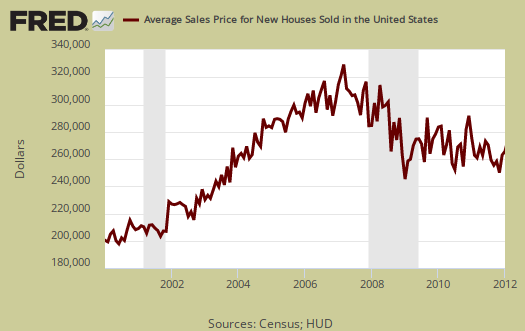
January's average price was $261,600. December's average new home price was revised to $264,900. The average home price is around early 2004 levels and simply has not come down enough to meet that new normal of low wages for most of America. The average includes those million dollar homes, which registered at least 1,000, over $750,000 for December and January. These figures are based on only 22,000 not seasonally adjusted monthly units sold in January 2012 (remember the reported sales volume numbers are annualized). Sell a few McMansions, at these overall sales levels, it boosts the average price.
January's the median price was $217,100, whereas December's median price was $216,500. Median means half of new homes were sold below this price.

If one looks at median and average sales prices, they are still out of alignment with wages and salaries, which are flat for over a decade, even with record low mortgage rates.
The variance in monthly data is so large, all one can say is the volume in new home sales seems to have stabilized to the new normal, which is at record lows, and inventories are returning to normal, which implies the new homes market has adjusted to the new normal. Anyone else despise those buzz phrases designed to hide the rotten economy created by the press?
Calculated Risk is a fantastic analysis site on housing data compares new home sales to recessionary periods and goes back to 1963 in data comparisons.
Recent comments