
Business Inventories, or Manufacturing and Trade Sales and Inventories, show a no change in June inventories and a -0.1% change for May. Sales increased 0.2% for June and 1.1% for May. This is really bad news for Q2 GDP.
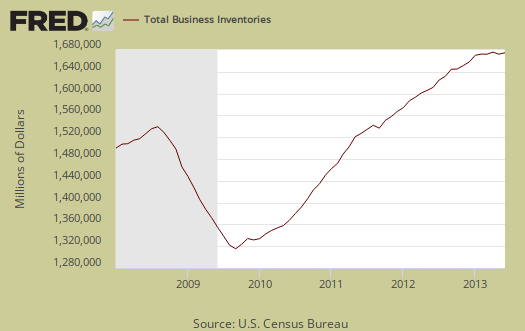
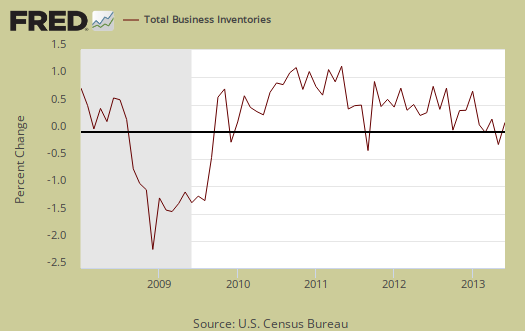
The cause is wholesale inventories, which declined -0.2% for June and -0.6% for May. Below is the monthly percent change for business inventories.
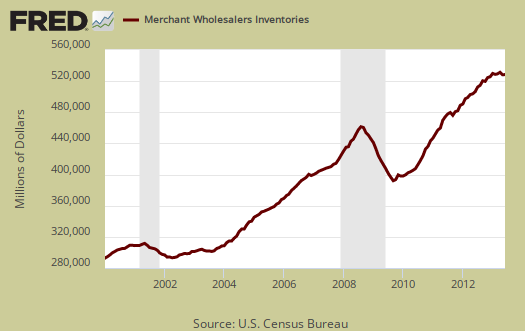
Below is a graph of just wholesale inventories. Notice how the downturn in wholesale inventories shadows recessions, marked by the gray bars.
This report includes:
The data that is used as input for the Manufacturing and Trade Inventories and Sales (MTIS) economic indicator release is collected by three separate surveys: the Manufacturers' Shipments, Inventories and Orders Survey (M3), the Monthly Wholesale Trade Survey (MWTS), and the Monthly Retail Trade Survey (MRTS).
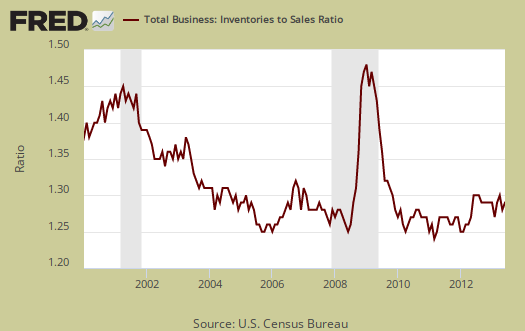
The inventories to sales ratio is fairly flat, and now stands at 1.29. This ratio tells us how long it would take to sell all of the inventory on hand. Below is a graph of inventory to sales ratio.
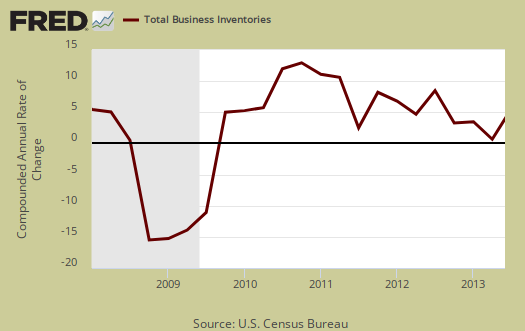
Below is a graph of the annualized change in all business inventories. As we can see this change was lower for Q2 than Q1.
This Census economic report covers Retail, Manufacturing and Wholesale inventories, which is pretty much most of the non-farm inventories the BEA uses for their change in private inventory calculations in the GDP report and national accounts. There are a host of adjustments, including inventory valuation that the BEA does to changes in private inventories for national accounts. NIPA is the big, gigantic "ledger" of the national books and from where GDP is calculated.
The change in non-farm private inventories contributed +0.28 percentage points of the 1.7% Q2 GDP , annualized, quarterly in real 2009 dollars.
The change for Q2 nonfarm private inventories, nominal, was $36.6 billion, as listed in the GDP advance estimate report. For Q1 the nominal change in nonfarm inventories was $24.5 billion. From just today's business inventories report, in nominal amounts, not annualized and not adjusted for valuations, we get a $2.5 billion change in Q2 business inventories. Compare that to Q1, where business inventories saw a $15.4 billion dollar change.
What does this imply? That the Q2 GDP contribution for changes in private inventories will be less than Q1 and as it stands right now, it was estimated to be more. In other words, expect to see changes in non-farm private inventories be close to zero for Q2 2012 GDP.
Another way to look at this is the nominal, annualized percentage change in business inventories for Q2 is 0.6%, for Q1, 3.8%. Using rough ratios we estimate nonfarm business inventories will be revised from a 0.28 percentage point contribution, down to zero. This implies the next GDP revision, will revise the change in private inventories that will result in a shave off of 0.2 to 0.3 percentage points from Q2 GDP.
Previously, we estimated the magical trrade deficit shrink would bring up Q2 GDP from 1.7% to at least 2.5%. Now that business inventories have been released, we believe the next estimate for Q2 GDP will be about 2.2 to 2.3%.
Easy come, easy go and no doubt with the way national product is tabulated there is yet another funky mystery yet undiscovered. Regardless what Q2 GDP comes in at, the sudden shrink of the trade deficit will not last, so reported growth will be somewhat artificial and illusionary.
Recent comments