
Personal Income and Outlays for March 2010 was released today. Once again, Americans' spending is increasing more than their incomes. Even more interesting, the increase in unemployment insurance benefit payouts equaled the increase in wages and salaries from private industries, $11.8 billion, at a seasonally adjusted annual rate. The total government transfer payments was over 66% of the personal income growth for March.
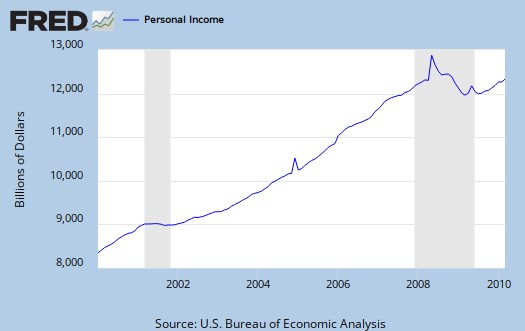
Personal income increased $36.0 billion, or 0.3 percent, and disposable personal income (DPI) increased $32.3 billion, or 0.3 percent. Personal consumption expenditures (PCE) increased $58.6 billion, or 0.6 percent.


The good news, if there can be any, that incomes showed a slight increase. The bad news is consumer spending increased double what the change in incomes was.
Below is PCE or consumer spending. It's increasing and was reflected in the Q1 2010 GDP report, meanwhile income isn't keeping up (The below graphs use real, or adjusted for inflation).


As noted in this graph-o-rama on personal income, taken from the Q1 2010 GDP report, it's clear people are digging into their savings to spend. Ugh, look at the below savings graph and see how the slope (trend) is headed straight for the inane home equity loan/debt spend of the housing bubble amounts and behavior earlier in the past decade.

Personal saving -- DPI less personal outlays -- was $304.0 billion in March, compared with $332.2 billion in February. Personal saving as a percentage of disposable personal income was 2.7 percent in March, compared with 3.0 percent in February.

Other things to note, Unemployment insurance benefits increased 11.8% from February and social security payments increased 24.8%.
Recent comments