
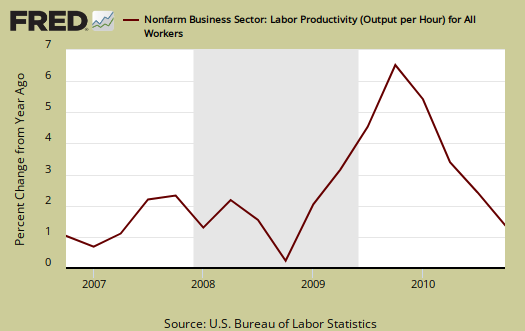
Q4 2010 Productivity & Costs was released today. Labor productivity increased +2.6%. Output increased +4.5% and hours worked increased 1.8%. For the year, annual productivity increased +3.6%, output +3.7% and hours +0.1%.
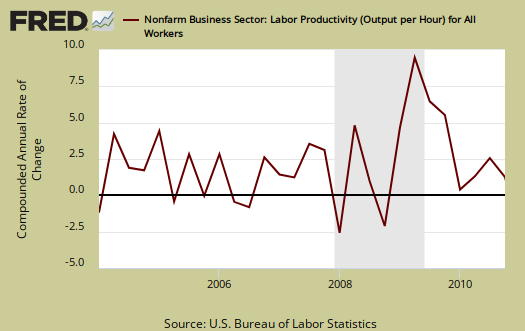
Below is business, nonfarm labor productivity per quarter.
Unit labor costs dropped -0.6% for Q4 2010 and are down -1.5% for the year. Frankly this implies workers are being squeezed and squeezed to the point they are flat as pancakes. Real wages decreased -0.6% for Q4 2010 and are only up 0.3% for 2010.
The basic equation for labor productivity is , where Q is the total output of industry.
How does the DOL calculate labor productivity?
Labor productivity is calculated by dividing an index of real output by an index of the combined hours worked of all persons, including employees, proprietors, and unpaid family workers.
L, or Labor, is measured in hours only. Both values are normalized to a base year, 2005. Output directly correlates to real GDP, minus the government, all of those nonprofits and our infamous, often illegal nannies and gardeners. The output, or is about 75% of real real GDP reported. Farms, if you can believe this, only subtract off about 1% from Output totals. Labor productivity is reported annualized. The main productivity numbers above are all business, no farms. This does include the manufacturing sector.
Annual nonfarm business productivity yearly change, was 3.6% and the quarterly change from one year ago is 1.7%.
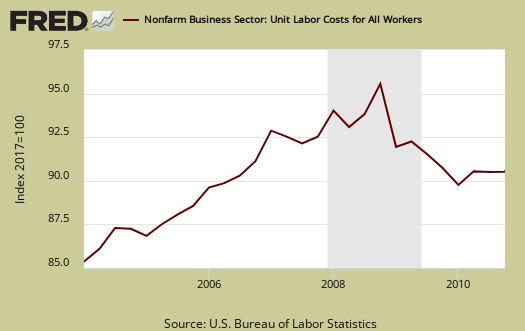
Below is the unit labor costs, compounded annual rate, percent change. Unit labor costs decreased -0.6% for Q4 2010, but are down -1.5%, on average, for the year.
BLS defines unit labor costs as the ratio of hourly compensation to labor productivity, or . For more formula definitions see the BLS handbook (yes this is the right page for labor productivity equations and calculations, I wouldn't do that to ya). From the report is the relationship of the ratios:
Increases in hourly compensation tend to increase unit labor costs and increases in output per hour tend to reduce them. Over the last four quarters, unit labor costs declined 0.2 percent, as hourly compensation and productivity increased 1.5 percent and 1.7 percent, respectively

Graphed below are unit labor costs, indexed to 2005. Notice the decline starting in the Great Recession, that's right, we're becoming mega cheap.
From the below report text, whether we're growin' or contractin' bottom line workers are getting the shaft (my interpretation of course).
The nonfarm business sector experienced productivity growth of 3.6 percent from 2009 to 2010 and 3.5 percent from 2008 to 2009. However, the 2010 increase in output per hour was due to a 3.7 percent increase in output as hours edged up 0.1 percent, whereas the 2009 productivity gain resulted when output fell 3.8 percent and hours fell 7.0 percent. In both years, strong productivity growth in nonfarm business was accompanied by declines in unit labor costs. By contrast the previous three years (2006-2008) were marked by modest productivity gains and increases in unit labor costs of more than two percent.
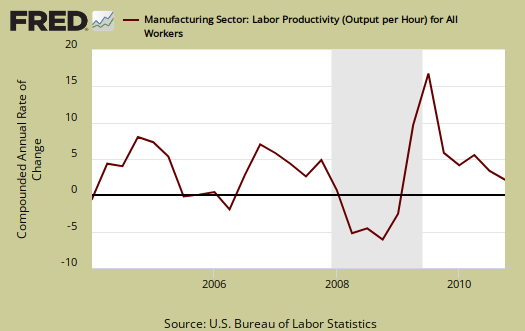
The BLS also reports separately on manufacturing productivity, but uses a different calculation method than the one for business productivity. So, don't think ya can subtract the below and get services productivity, the two ain't the same.
Manufacturing is sales, removing duplicates, adjusting for prices and output () is correlated to shipments and the industrial production. indexes. Hours are hours like above. Page 4 of the report has the manufacturing productivity measurement nitty gritty.
Manufacturing productivity increased +5.8% in Q4 2010, manufacturing output increased +3.7 % while hours worked decreased -2.0%. For the yearly average, manufacturing productivity is up 6.0% in comparison to 2009 and in durable goods alone the average yearly change in productivity was 8.2%. This is the largest manufacturing productivity yearly increase since 2003.
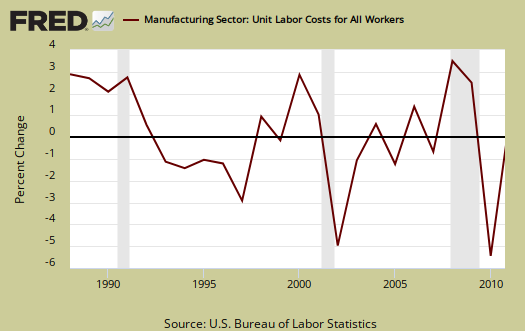
Manufacturing unit labor costs are down -2.9% for Q4 2010 and in comparison to Q4 2009, down -3.0%. Why, real compensation (wages), increased +0.2% for Q4 2010 but is dow -1.7% in comparison to Q4 2009.

Now check this out, for the yearly average:
Unit labor costs in the manufacturing sector fell 4.5 percent—the largest decline in annual manufacturing unit labor costs since the series began in 1988.
Corporations are squeezing blood from a stone! Welcome to China America!
What you see these days in productivity is not what it appears. The press will claim increased productivity is a great thing, but it's clearly not translating into wages and jobs for workers.
While leads me to this paper from the Monthly Labor Review, The compensation-productivity gap: a visual essay. Now these are the people who maintain the BLS productivity statistics. In the report, they go over their methods, calculations, which can make a huge difference in results. Bottom line they show since the 1970's, workers are getting less and less of the labor share or payout, less of a slice from the American pie called increased economic output. What they found was most of the productivity vs. how much you get in your pocket to spend gap before year 2000 could be attributed to a couple of different measures for inflation. After 2000, the gap is because workers are getting screwed. From the paper:
Labor share is a measure of how much of the economic pie goes to all workers. When labor share is constant or rising, workers benefit from economic growth. When labor share falls, the compensation–productivity gap widens. Concurrently, nonlabor costs—which include intermediate inputs into production and returns to investments, or profits—represent a greater share of output.
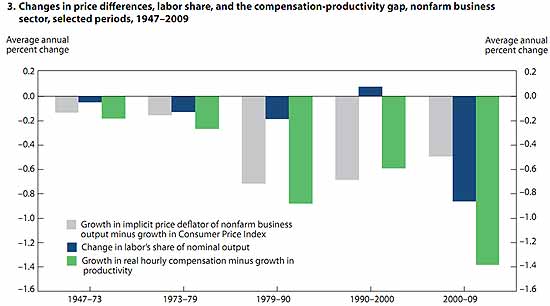
Their paper is loaded with graphs, but the above was reprinted for it shows clearly, since 2000, American workers are simply getting shafted while those making the profits are taking it to the bank.
Here is the Q3 2010 productivity report, unrevised.
Recent comments