
The Consumer Price Index increased by 0.2% for May. Gasoline alone increased another 2.3% for the month. Inflation with food and energy price changes removed increased 0.2% with shelter and medical costs once again driving the increase. From a year ago overall CPI has risen 1.0%. Without energy and food considered, prices have increased 2.2% for the year. CPI measures inflation, or price increases.
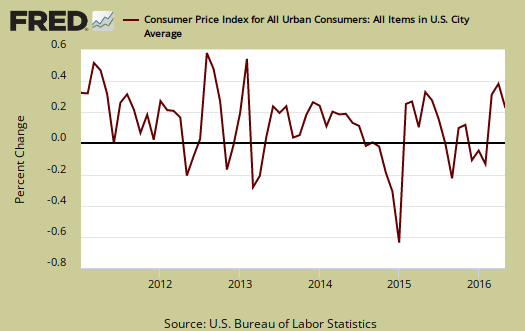
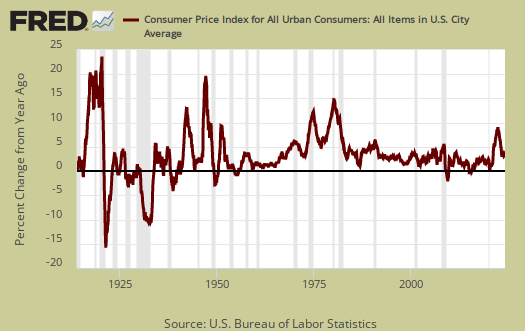
Yearly overall inflation is shown in the below graph. This is clearly going to change as gas prices raise their ugly head.
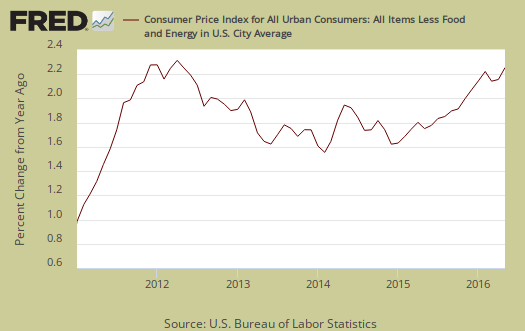
Core inflation, or CPI with all food and energy items removed from the index, has increased 2.2% for the last year. For the past decade the annualized inflation rate has been 1.9%, so this is running above.
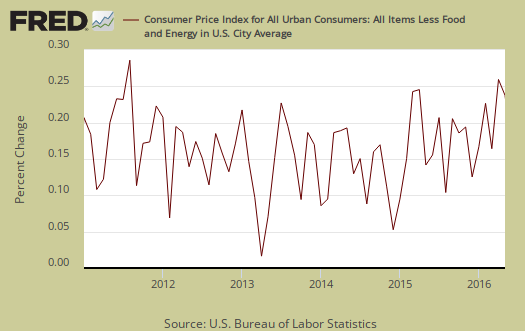
Core CPI's monthly percentage change is graphed below. This month core inflation increased 0.2%. Within core inflation, shelter increased 0.4%, with monthly rental costs increasing the same, 0.4% while home ownership increased 0.3%. Used cars and trucks dropped -1.3%. Car insurance increased 0.9% for the month and the previous month increased 1.2%.
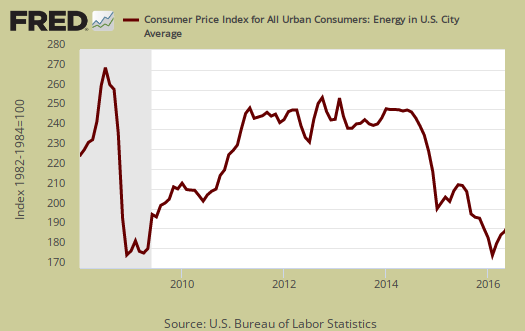
The energy index is down -10.1% from a year ago. The BLS separates out all energy costs and puts them together into one index. For the year, gasoline has declined --16.1%, while fuel oil has dropped -23.6%. Graphed below is the overall CPI energy index.
Graphed below is the CPI gasoline index and we can see prices are now rising dramatically, boo-hoo.

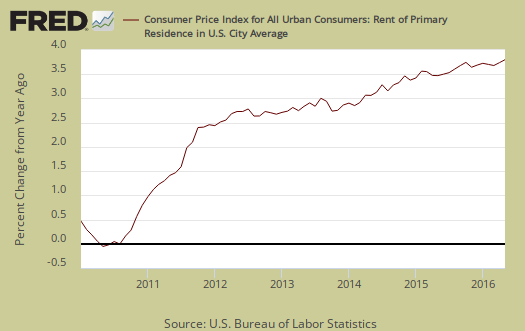
Core inflation's components include shelter, transportation, medical care and anything that is not food or energy. The shelter index is comprised of rent, the equivalent cost of owning a home, hotels and motels. Shelter increased 0.4% and is up 3.4% for the year, which is a lot. Rent of a primary residence just keeps increasing and this month by 0.4% and is up 3.8% for the year. Graphed below is the rent price index.
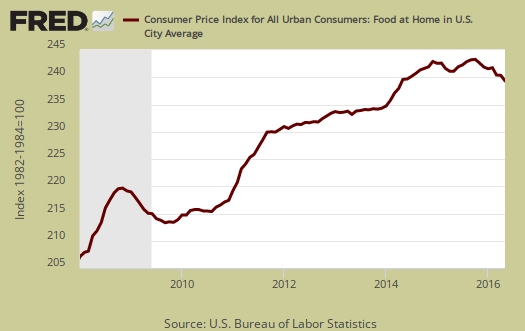
Food prices decreased -0.2% for the month. Food and beverages have now increased just 0.7% from a year ago. Groceries, (called food at home by the BLS), slid a whopping -0.5% for the month, and are down -0.7% for the year. This is the fifth consecutive decline and all areas of groceries decreased in price. Eating out, or food away from home increased 0.2% for the month and is up 2.6% for the year.

Graphed below are grocery prices, otherwise known as the food at home index.
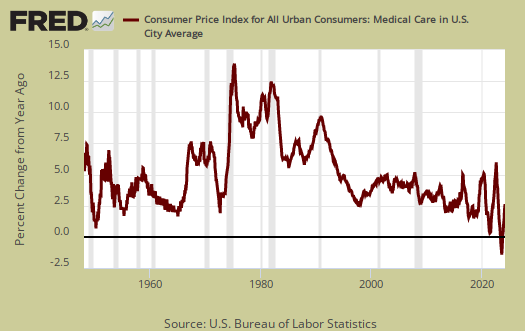
Medical care is a large part of core inflation. Medical care services were up 0.5% for the month and have increased 3.5% for the year. Graphed below is the overall medical care index, which increased 0.3% for the month and is up 3.2% from a year ago.
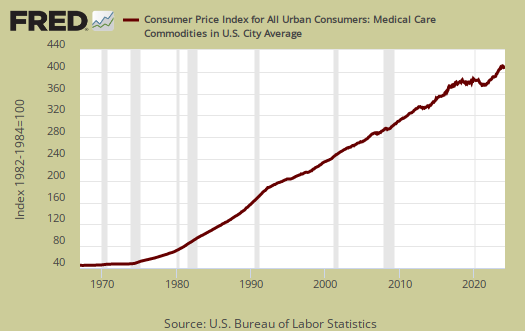
Below is a graph of the medical commodities index, which is mostly prescription drug prices. Medical commodities decreased by -0.2% for the month and is up 2.2% for the past year.
Real hourly earnings where unchanged for all employees. Real means wages adjusted for inflation. CPI increased 0.2% and wages increased by 0.2%, which cancelled each other out. For the year real hourly earnings have increased 1.4%, just slightly staying ahead of inflation The average real hourly wage is now $10.69. Weekly real earnings also had no change. Real weekly earnings now stand at $367.70. Average weekly hours also did not change for the month and are 34.4/wk. There is a separate category for production and nonsupervisory employees and their real hourly earnings decreased -0.2%.
CPI details
The DOL/BLS does take yearly surveys on where the money goes in the monthly budget, but as one can see, food and energy are significant amounts of the monthly finances. Run away costs in these two areas can break the bank, so can food. Additionally CPI uses substitution, so if flour goes through the roof, somehow we're all just fine with oats and prices didn't really overall increase much. Here is the BLS CPI site, where one can find much more details, information on calculation methods and error margins.
Other CPI report overviews, unrevised, although most graphs are updated, are here. If you're wondering why the graphs display different figures from the text, the graphs calculate percentages from the index and do not round. The actual data from the BLS report does round to one decimal place. In other words, 0.05% is rounded to 0.1%.
Recent comments