
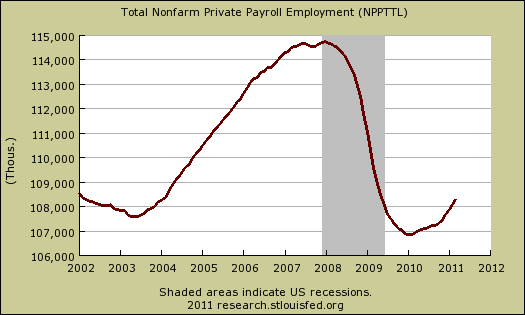
ADP, a private organization, released their private payrolls jobs report. This month ADP is reporting a gain of 201,000 private sector jobs in March 2011. Below are the reported private sector jobs from ADP. This report does not include government, or public jobs.
We take the ADP report with a grain of salt, especially on a monthly basis. Why? Because there is a mismatch against the BLS jobs report. To date, the number of private nonfarm payroll jobs ADP reports versus what the BLS reports and on a month-to-month and even cumulative basis don't match. This monthly error is often large, especially when looking at small job growth overall (< 400,000 jobs per month) on a month to month basis.
Below is the cumulative difference between what the ADP reports as the private nonfarm payroll jobs vs. the BLS (ADP minus BLS). This line shows the divergence, over time in number of nonfarm private payroll jobs reported between the two reports.
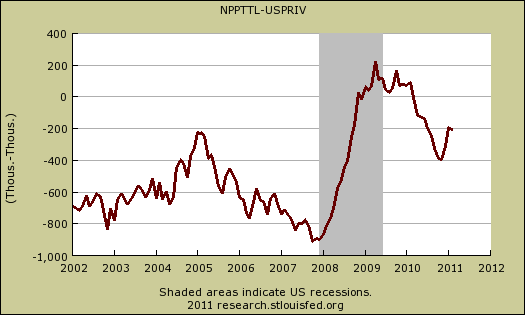
ADP speaks and Wall Street swoons, then people come crashing down when a few days later the BLS monthly unemployment report is released and shows...there was no real monthly job growth after all. This is the divergence between the two reports. It's also not being recognized by ADP that one must have a good 200,000 jobs just to keep up with U.S. population growth.
While ADP notes a simple correlation of 0.95, well, a 5% error between monthly reported jobs numbers is an average, and we can see on some months the differences are quite large and around 2008, the difference started to hit about 900,000 jobs.
ADP does use the same seasonal adjustment as the BLS, but their other methodology and even sampling size are different, is proprietary and also seems to change from month to month. Generally the ADP claims their sample size is at least twice as large as the BLS current employment statistics survey. The ADP does not incorporate a birth/death model, although they do categorize jobs by the NAICS codes, the same as the BLS.
Bottom line, the official report, upon which other metrics are based, is the BLS. Additionally, since the BLS is our government, we get to find out exactly what methods and models they use, unlike ADP.
All of this said, the reality is the The United States currently needs about 10.5 million jobs to get back to pre-recession levels, taking into account population growth and the labor participation rate back in December 2007. Anyone jumping all over themselves over 200,000 jobs added in one month, at minimum, isn't taking population growth into account and is experiencing wishes and dreams instead of what's true.
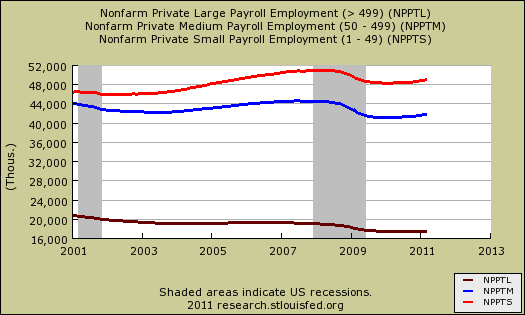
There is one thing to note that is worth looking at, especially due to it's relativity within the same report (and methods). ADP reports on large vs. medium vs. small businesses and their job creation per business size. In March:
Employment among large businesses, defined as those with 500 or more workers, increased by 17,000 while employment among medium-size businesses, defined as those with between 50 and 499 workers, increased by 82,000. Employment for small businesses, defined as those with fewer than 50 workers, rose 102,000 in March.
Below is the graph of large businesses, median business and small businesses in terms of their respective jobs added. Notice how large businesses have been declining or flat since the start of the ADP report, just about the time offshore outsourcing and the China PNTR came into effect. Small businesses, on the other hand, have increased employment. May I suggest that small businesses are not international, they are not signing offshore outsourcing contracts and moving jobs to India and China. Multinationals, on the other hand, the below decade trend line clearly shows these so called U.S. corporations have abandoned the U.S. worker, on whole.
Recent comments