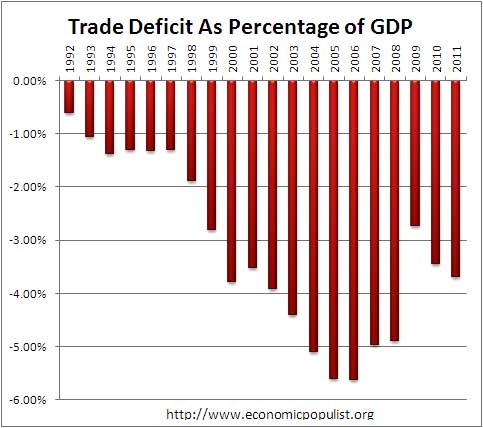
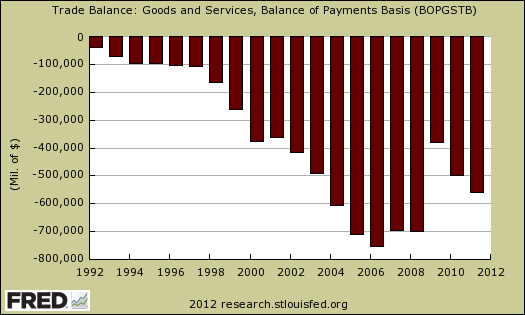
The annual trade data out of the December trade report has some shocking results. The 2011 trade deficit increased 11.6% from 2010. As a percentage of GDP the trade deficit is returning to pre-recession levels. The trade deficit is now 3.7% of U.S. GDP, up from 3.4% in 2010. The worst was 2006, when the soaring out of balance, trade deficit was 5.6% of GDP. Below is a graph of the U.S. trade deficit as a percentage of U.S. annual nominal GDP.

For 2011, exports of $2,103.1 billion and imports of $2,661.1 billion resulted in a goods and services deficit of $558.0 billion, $58.0 billion more than the 2010 deficit of $500.0 billion. For goods, exports were $1,498.2 billion and imports were $2,235.3 billion, resulting in a goods deficit of $737.1 billion, $91.2 billion more than the 2010 deficit of $645.9 billion. For services, exports were $604.9 billion and imports were $425.9 billion, resulting in a services surplus of $179.0 billion, $33.2 billion more than the 2010 surplus of $145.8 billion.
The larger the trade deficit is, as a percentage of nominal GDP, the more a trade deficit stunts domestic economic growth. Below is a graph of the annual trade deficit since 1992.

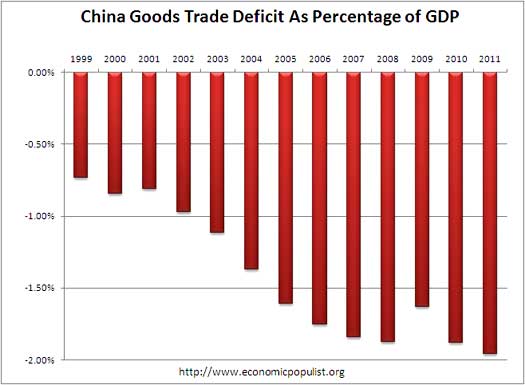
The goods trade deficit with China hit a new record, $295.5 billion, just shy of $300 billion and an annual 8.2% increase. In 2010 the U.S. trade deficit with China was $273.1 billion. Below is a graph of the U.S.-China goods trade deficit.

On an annual basis, using Census accounting methods, the goods only trade deficit was -$726.291 billion. This means China, including oil, was 40.7% of the goods trade deficit.
The petroleum related goods deficit increased $61.31 billion from 2010, a 23.1% increase. Petroleum related goods by end use, were 81.7% of the total 2011 goods trade deficit. The end-use classification system means what purpose those goods will primarily be used for. This is why by end use petroleum related goods are so much higher than say just crude oil imports.
By SITC categories, the annual deficit in fuel minerals was $327.454 billion. The SITC Commodities goods trade deficit was $726.291 billion in 2011. Assuming China does not export any fuel minerals, or oil, natural gas, to the United States, we can subtract off the SITC fuel minerals 2011 trade deficit from the total goods trade deficit. This gives an annual non-mineral fuels goods trade deficit of $398.837 for 2011. This means China, by itself, is 74.08% of the non-mineral fuels goods trade deficit! Clearly after oil imports, China is by far the worse cause of the U.S. trade deficit.

The above graph shows the U.S.-China goods trade deficit as a percentage of U.S. GDP. 2% might sound small, but one must realize over 70% of U.S. GDP is personal consumption. When one is looking at trade deficits by GDP, they represent lost jobs, production, finished goods and less income. All of these production types of economic activity are multipliers. They multiply other economic domestic activity, such as other jobs, housing, investment and more consumer spending. In other words, 2% for one country to dominate U.S. GDP is way too much. So is 3.7% of the overall trade deficit.
Why do increasing trade deficits stunt economic growth? This is actually a basic accounting problem from national accounts, or balance of payments. Basically the trade deficit equals savings minus investments plus government revenues minus spending. Or in accounting speak:
where: represents exports,
eqauls imports,
are savings,
is investments,
equals taxes (government revenues) and finally
is government spending.
If the left hand side of the equation is negative and increasing, something on the right hand side of the equation has to give. So, either we run large government budget deficits, or we private people borrow our brains out and don't save a penny. In other words if the budget is balanced then with high trade deficits, private savings must be less than private investment, a lot less. We're lookin' at over half a trillion dollar annual trade deficit here. Yes Virginia, large trade deficits have a negative multiplier effect on overall economic growth.

Renewable energy is the key
Renewable energy is the key to our future buy allowing us to burn less coal and gas and exporting it instead of burning it thereby earning tax income so they can charge less overall taxes which is the purpose it serves best.
how partisan of you
First, by far, if one looks at the data, the largest energy import is oil. Second, coal and gas add to global warming. Third, we have plenty of gas and coal but politics won't let things to moved to gas from gasoline. Forth, China went and dumped, is giving massive government subsidies, undercutting any start-up U.S. industry in alternative energy.
The key is to reduce oil imports and another key is to subsidize more heavily, plus put import restrictions on alternative energy so a U.S. industry can start and grow.
Additionally, the U.S. electrical grid is extremely inefficient, it wastes much more power than it delivers. We need a new distribution system, as well as more of a "localized energy generation" system to take advantage of local resources as they occur (i.e. methane on farms, wind power on coasts, wave power on coasts and so on).
Literally we have "solar panel" manufacturers offshoring their actual manufacturing to China. There are so many vested interests when it comes to energy, not an objective, smart design or fact shall be had.
Right, we see how well
Right, we see how well renewable energy subsidies have worked so far, e.g. Solyndra et al.
The key is driving down the price of electricity in this country. We do this by an "all of the above" strategy, which, despite the rhetoric, is antithetical to the aims of this current, pathetic administration.