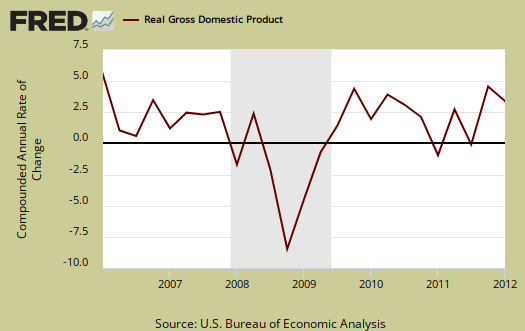
Q1 2012 real GDP showed 2.2% annualized growth.. This article overviews and graphs the BEA statistical release for first quarter gross domestic product.

Q1 GDP saw much less of an increase in private inventories build up, part of investment, an increase in personal consumption and a not to be believed increase in exports.
As a reminder, GDP is made up of:  where Y=GDP, C=Consumption, I=Investment, G=Government Spending, (X-M)=Net Exports, X=Exports, M=Imports*.
The below table shows the percentage point breakdown of individual GDP components contribution to overall GDP. The difference, or spread, between Q4 and Q1 components is by percentage points.
|
Comparison of Q4 2011 and Q1 2012 GDP Components |
Component |
Q4 2011 |
Q1 2012 |
Spread |
|
GDP |
+2.96 |
+2.20 |
-0.76 |
|
C |
+1.47 |
+2.04 |
+0.57 |
|
I |
+2.59 |
+0.77 |
-1.82 |
|
G |
–0.84 |
–0.60 |
+0.24 |
|
X |
+0.37 |
+0.73 |
+0.36 |
|
M |
–0.63 |
–0.74 |
-0.11 |
Recent comments