GDP

Bad News for Economic Growth as Q2 2012 GDP is Revised Down to 1.25%

Q2 2012 real GDP now shows 1.25% annualized growth after revisions. The advance second quarter GDP estimate was 1.5%, whereas the second revision reported 1.7% GDP growth. The BEA rounds their final GDP numbers, so the actual GDP reported was 1.3%. When we're grabbing economic crumbs, 0.05 percentage points makes a difference.


What the Q2 GDP third estimate shows is a barely breathing economy. Businesses shed inventories, consumers spent way less, a dramatic swing from the Q2 GDP advance report and investment generally is down from the 1st quarter. Shedding inventories can be a recession indicator. Durable goods spending literally vanished in Q2, also a recession indicator. The drought showed up in Q2 GDP, negatively impacting farm inventories and potentially other GDP components indirectly.

Retail Sales Decline, -0.5%, Quarterly Sales Decline -0.2%, Not Seen Since Q1 2009

June 2012 Retail Sales decreased, by -0.5%, and this month one cannot blame just falling gas prices. Autos & Parts alone dropped -0.6% while auto dealers, part of Autos & Parts, declined -0.7%. Minus autos & parts, retail sales also decreased, -0.4%. This is the 3rd month in a row retail sales have declined. June Retail sales are up 3.8% from the same time last year.

Trade Deficit for May 2012 - $48.7 Billion

The U.S. May 2012 monthly trade deficit declined $1.91 billion to $48.68 billion. This is a 3.78% monthly decrease in the trade deficit, all due to reduced imports. Exports decreased $359 million, or -0.20%. Imports declined $1.55 billion, which is a -0.67% decrease from April. The decline in oil prices is the reason the trade deficit shrank for the month.


Trade Deficit for March 2012 - $51.8 Billion, Little Effect on Q1 GDP Revision

The U.S. March 2012 trade deficit jumped $6.41 billion to $51.83 billion in a month. This is a 14.1% monthly increase in the trade deficit. Exports increased $5.28 billion, a 2.9% increase from last month. Imports increased $11.69 billion, which is a 5.15% increase from February.


Q1 2012 GDP 2.2%

Q1 2012 real GDP showed 2.2% annualized growth.. This article overviews and graphs the BEA statistical release for first quarter gross domestic product.
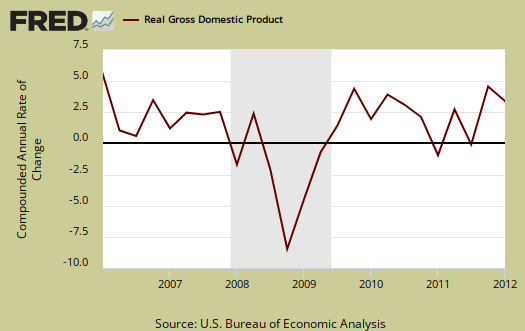


Q1 GDP saw much less of an increase in private inventories build up, part of investment, an increase in personal consumption and a not to be believed increase in exports.

As a reminder, GDP is made up of: Y=C+I+G+{\left(X-M\right)} where Y=GDP, C=Consumption, I=Investment, G=Government Spending, (X-M)=Net Exports, X=Exports, M=Imports*.

The below table shows the percentage point breakdown of individual GDP components contribution to overall GDP. The difference, or spread, between Q4 and Q1 components is by percentage points.


Comparison of Q4 2011 and Q1 2012 GDP Components

Component

Q4 2011

Q1 2012

Spread
GDP +2.96 +2.20 -0.76
C +1.47 +2.04 +0.57
I +2.59 +0.77 -1.82
G –0.84 –0.60 +0.24
X +0.37 +0.73 +0.36
M –0.63 –0.74 -0.11

Pages