The U.S. February 2012 trade deficitshrank $6.5 billion to $46 billion in a month. This is a 12.37% monthly decrease in the trade deficit. January's trade deficit was revised slightly down to $52.5 billion.
The January 2012 U.S. trade deficit increased $2.14 billion to $52.57 billion in a month. This is a 4.25% increase from last month in the trade deficit and the highest since October 2008. December's trade deficit was significantly revised up by $1.62 billion.
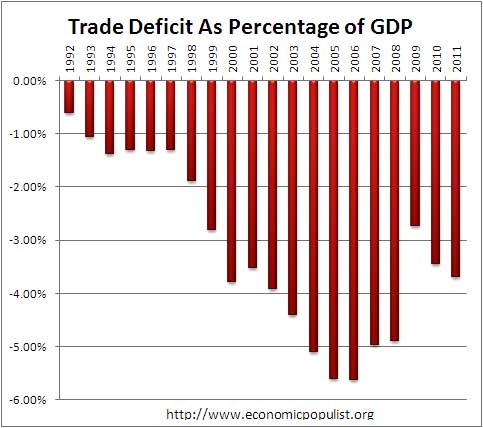
The annual trade data out of the December trade report has some shocking results. The 2011 trade deficit increased 11.6% from 2010. As a percentage of GDP the trade deficit is returning to pre-recession levels. The trade deficit is now 3.7% of U.S. GDP, up from 3.4% in 2010. The worst was 2006, when the soaring out of balance, trade deficit was 5.6% of GDP. Below is a graph of the U.S. trade deficit as a percentage of U.S. annual nominal GDP.
The December 2011 U.S. trade deficit increased $1.74 billion to $48.8 billion in a month. This is a 3.7% deficit increase from last month in the trade deficit. November's trade deficit was revised down by $694 million. December exports increased $1.23 billion, or -0.69%, while imports increased $2.97 billion, or +1.32%.
The November 2011 U.S. trade deficit jumped $4.48 billion to $47.8 billion in a month. This is a 10.36% deficit increase from last month in the trade deficit. October's trade deficit was revised down slightly by $195 million. Exports decreased -$1.54 billion, or -0.86%, while imports increased $2.95 billion, or +1.32%.
The October 2011 U.S. trade deficit decreased $704 million to $43.48 billion. This is -1.59% drop from last month in the trade deficit. Septembers's trade deficit was revised up from $43.11 billion to $44.17 billion, a $1.06 billion increase.
The September 2011 U.S. trade deficit decreased $1.81 billion to $43.11 billion. This is 4.03% drop from last month in the trade deficit. August's trade deficit was revised down from $45.61 billion to $49.92 billion. Exports increased $2.5 billion, or 1.41%, while imports increased $688 million, or 0.31%.
The August 2011 U.S. trade deficit increased $17 million to $$45.61 billion. This is no change (0.037%) from last month in the trade deficit. July's trade deficit was revised up slightly from $44.8 billion. Exports decreased by $95 million, or no change, while imports decreased $100 million, or 0%.
The July 2011 U.S. trade deficit decreased $6.8 billion to $44.8 billion. This is a 13.11% monthly decrease in the trade deficit. Exports increased by $6.2 billion, or 3.61%, while imports decreased $0.5 billion, or 0.22%. China imports, not seasonally adjusted, increased 1.12% in July, creating a $27 billion trade deficit with China.
The June 2011 U.S. trade deficit increased $2.3 billion to -$53.1 billion. This is a 4.4% monthly increase in the trade deficit. Both imports and exports decreased, showing a slowing of global trade. The trade deficit wasn't this big since October 2008. Exports decreased -$4.1 billion, or -2.34% from last month while imports decreased -$1.9 billion, or 0.83%.

Recent comments