
The April 2010 monthly unemployment figures are out. The rate increased to 9.9% and the number of jobs gained is 290,000. How the rate can increase when the U.S. gained that many jobs will be answered below.
Nonfarm payroll employment rose by 290,000 in April, the unemployment rate edged up to 9.9 percent

Below is the nonfarm payroll, seasonally adjusted:

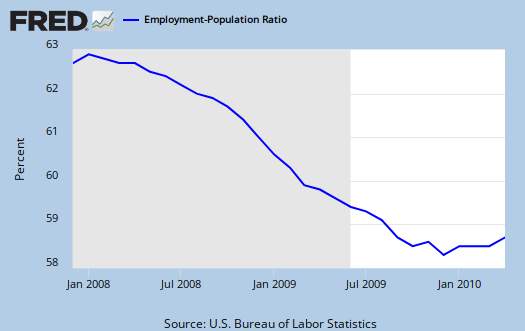
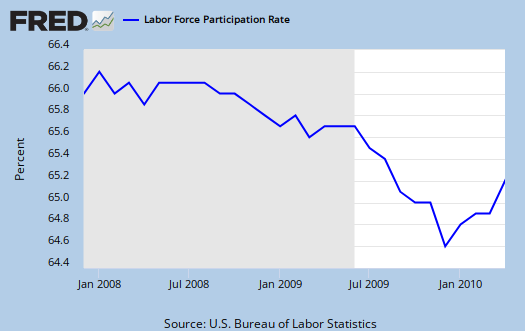
The civilian labor force participation rate increased 0.3%, to 65.2% as did the employment to population ratio, up 0.2% to 58.8%. That means there are more employed people to the civilian non-institutional population, as a ratio, than last month. That's a change (see graph below).
The labor force increased 805,000. Of those who entered the labor force, 195,000 were re-entrants. Then labor force newbies increased by 34,000. The changes of the civil labor force for employed was 550,000. The changes for those unemployed was 255,000. Since that doesn't match the unemployment rate overall, (which would give an employment rate of 725,000 instead of 550,000), obviously most of those who entered the labor force are looking for work. On just the labor force changes for April, it gives an unemployment rate of 32%, so clearly people came out of the woodwork in hopes some damn jobs are now available.
Those not being counted or those not in the labor force dropped 635,000.

The first thing you probably want to know is how many of those jobs are Census workers? The report claims 66,000 of the above jobs are temporary Census workers.
- Long term unemployed - up 169, 000 to 6.7 million
- Forced Part Time - 9.2 million
- Marginally attached to the labor force - 2.4 million
Of the Marginally attached, 1.2 million are discouraged.
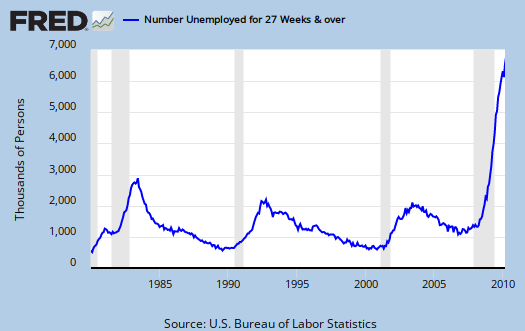
U6, or Total unemployed, plus all persons marginally attached to the labor force, plus total employed part time for economic reasons, as a percent of the civilian labor force plus all persons marginally attached to the labor force, (table A.15), increased to 17.1%. That's not good. Then 45.9% of the official unemployed have been so for 27 weeks or longer.
There were 26,200 temporary jobs added in addition to the 66,000 Census workers. One needs at least 100,000 and some estimate up to 300,000 permanent full time jobs, added each month to keep pace with U.S. civilian workforce population growth. That's not general population, that's the group needing a job. To even get back to pre-recession unemployment rate levels we need a good 400,000 jobs created each month.
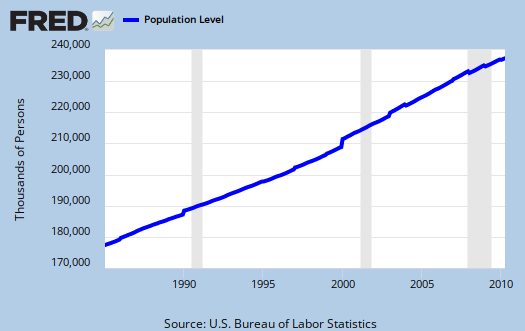
So, how did the unemployment rate tick up? Because more people are being counted as looking, re-entering the workforce and the population increased. Below is the graph of the civilian non-institutional population, which is the largest super-set of the potential labor force, larger than the civilian workforce, due to those who are not looking for work, retired and so on being counted in this figure. It increased this month by 170,000. Then, those being counted increased 805,000, as amplified above. Unemployment is a percentage, a ratio.
In looking over table B1 we can get a little more detail on what kind of jobs were created (and lost) on the permanent jobs front.
- Financial: +3,000
- Information: -3,000
- Construction: +14,000
- Manufacturing: +44,000
- Mining & Logging: +7,000
- Health and Education: +45,000
- Leisure and Hospitality: +45,000
- Professional & Business Services: +80,000
- Trade, Transportation, Utilities: -3,000
- Retail Trade: +12,400
- Government: +59,000
You probably also want to know the birth/death model. What is that? It's a statistical adjustment to compensate for new businesses and dead businesses who are not actually tallied by data reports. Those jobs created and died outside the statistical reporting time window due to lag. So, the BLS estimates how many jobs can be attributed to those firms which are not actually counted. This month's adjustment was 188,000 jobs. Now one cannot directly subtract the birth/deal model monthly numbers, because unemployment data is seasonally adjusted, yet the birth/death adjustment is not seasonally adjusted, get that? Anywho, jobs attributed to new and dead businesses are just an estimate in so many words. Yet, if you look at the data, knowing full well small businesses died on the vine in droves this recession, well, something doesn't smell right. Also, consider comparing to the 32,000 private sector job creation ADP report. Subtract off 59,000 government jobs and one gets a strong mismatch of 231,000 vs. 32,000 from the ADP report.
The average work week flat lined, an increased of 0.1 hr. to 34.1 hrs/wk. Average earnings (drum roll please), increased a penny.
There were also two revisions:
The change in total nonfarm payroll employment for February was revised from -14,000
to +39,000, and the change for March was revised from 162,000 to 230,000.
Here is the original uenmployment report for March.
There is much discussion on the discrepancies between the Household and Establishment survey. The BLS has released Employment from the BLS household and payroll surveys: summary of recent trends, which point to sampling error, in particular, the population growth. Also, workers off the books, in the underground economy, maybe included in the household survey.
Subject Meta:
Forum Categories:
| Attachment | Size |
|---|---|
| 213.58 KB | |
| 77.14 KB |
One other note
The BLS Birth/Death model added 188,000 of those 290,000 jobs.
That's 62,000 more than April of last year.
birth-death model
It's in this report, although I've been adding to the post after the original publication date.
You cannot subtract directly SA data from not seasonally adjusted data.
That said.....
My problem with these estimates is I simply do not believe there were that many "New businesses" created uncounted jobs to make this primarily a "plus" and that's from 2007 onward. No way in hell. Small business loans dried up and they are still dried up. I guess we can look at the total number of starts and dissolution in businesses over this time period (remind me to check that out), but off the top of my head, I am like no way were there new businesses which magically generated all of these uncounted jobs. (unproved with data at the moment).
The market is in the midst
The market is in the midst of a crash right now so any possible positives from these numbers is being ignored in favor of bigger issues.
Citi Sees Up to 20% Selloff
"They can't continue to bail everyone out. You just move money from one balance sheet to another...that is simply not a solution, and markets realize this."
I wouldn't call these numbers postive
Although officially they do show a break in a trend. I'll get all happy talk when I see a report claiming 650k jobs have been created. I mean I got a slight buzz, "oh good" when I first laid eyes on the report, but after swimming around in all of the data for a few hours to write this post up, I'm like @&*)$&@ our stupid government is so in bed with the banksters, Wall Street.
Also, I believe we're going to have a significant "double dip" at minimum, at least by the end of 2010 if not now. My reasons are: Europe/contagion, gulf oil spill est. costs already in over $1 trillion, "stimulus" high point is Q2 2010, what kind of crap really is on the Fed Books, Fannie/Freddie never ending bail out, interest on the debt, failure of Congress to make significant financial reforms.
Stock market is probably going to be extremely volatile until Greece is resolved and they believe it's contained (which I don't).
Kool Aiders Will Call Them Positive
You know there is a concerted effort to make every stat into a positive by supporters of 'he who can do no wrong'
BirthDeath+Immigration+JobEntrants=New Jobs - JobdDstruction
Take 188,000 from birth/death net and add about 120,000 from legal and illegal immigration and we come close to the 290,000 jobs.
The difficulty with Birth Death is the seasonality. I understand the number if you mean the recent grads. But grads will not appear as stats until the May Stats come out.
I think the real calculation is New Jobs = New Grads + Job Re-Entrants + Immigration. But something would be wrong with that formula because of 'dark matter' of job destruction.That number includes all the new layoffs and new 'discouraged workers'.
BTW in 2008 5 Million small business failed. That number is also making the potential labor pool inflated.
Burton Leed
population/labor force
According to the BLS they do not take into account "immigration status" and that includes foreign guest workers. They will only write up "foreign born", which tells you nothing about illegal, green card, guest worker, which type of Visa and so on. That is pretty ridiculous for a domestic labor market metric, esp. with ~17 million "foreign born" in the labor force. This is something pretty ridiculous generally. Supposedly the U.S. is a melting pot, yet statistics are always broken down by males/females, white people, blacks & Hispanics. That's it too. It's like revisiting 1965 the way these stats are, regardless of what has changed in labor markets as well as hiring practices, in that time.
That said, there is a massive underground economy where employees are not registered, it's all cash under the table or no tax returns, phony ids and so on. But obviously if the estimates are right w/ 11-22 M illegals in the U.S., which is probably about 5% of the overall labor force (about 7.8 million participating who are here illegally), that will skew the numbers. It really skews the numbers in occupational employment rates. In other words if a STEM is displaced by a H-1B, the unemployment rate still comes up very low and that displaced STEM is now counted as a Wal-mart worker, instead of a displaced technical worker.
I'm Shocked
Massive underground economy? No tax returns? Phony id's? Cash under the table?
Does the IRS know about this or do they just harass people who pay taxes?
this is the insanity of this topic
If this topic is mentioned the EP rule of "no economic fiction" and that includes "Academic" fiction of which there is quite a bit, will be in maximum force. The reason is the minute one mentions even the slightest economic or labor market realities such as the truth that population affects labor markets, the accusations and insults come flying.
Yeah, the underground economy never being mentioned is interesting, and it's because the minute anyone talks about any of these factors the name calling comes flying around.
So, just be aware (and I dread the day frankly), if this is an EP topic I will be the labor economic, international migration flows/laws EP police admin. I'll be damned if we go into that entire degrading into name calling whatever insanity that goes on.
Ahhh!
Other than myself few here will believe anything you write about that. I promise not to post in that topic other than to say great post though if you do endeavor that way.
Reality doesn't seem to play well on the edges of either political idealogical avenues.
You are at heart a realist who sees both sides of the street so to speak and who doesn't seem afraid to say whats what. Something terribly missing from Government. I don't know what you do but someday you could make a great advisor to a good President. My actual take.
Increase unemployment Good News - yoh
Over at Bonddad, New Deal Democrat, following the financial media and congressional democrats says the increase in unemployment rate is a good thing, a good sign of an increasing strong economy. Surely this adds new meaning to Orwellian.
While I don’t expect more from the financial news and Bonddad, it is sad to see today Democrats on the Joint Congressional Committee questioning the people responsible for producing the employment report using their time to argue that the President’s economic policies are successful. It is especially sad to see African American representatives using their time to support their President and oblivious to the pain of unemployment and marginal employment with their people.
Que?
What committee? I missed this, so much stuff going on. Well, I have a funny feeling the green shooters will crash and burn when their portfolios do. ;)
The rest of us, down on the ground are saying "what are the jobs man".
On the increasing unemployment rate, well, gee, one can say people are getting registered because they are now looking for a job, but ya know, you can also look at U6 and that jumped, so uh, the worse number is that 27 weeks or longer count.
Joint economics committee on C-span
It was the Joint Economics Comm. It was on C-span today. The Bureau of Labor Statistics (BLS) was reporting on the employment numbers and the lead witness was the commissioner of the BLS - can't remember his name.
The African American congressmen was a John (?) Lewis. All he kept saying was how "good" (his word) the report was especially the "large number of jobs created in the private sector." And, the"Presidents program was working". The head of BLA didn't say a word, he just kept nodding and I swear there was a slight simile on his lips.
But, the biggest joke was Fox financial 'news?" They could not understand why the market would go down given the "positive labor report". I understand news 'slants', 'ideological bias', party loyalty and other subjective interpretations of reality. But, I'm starting to feel like Alice in Wonderland ("what's up is down; what's down is up) or like I'm "Waiting for Godot"
Bloomberg is claiming the household survey
shows more jobs and that they are under counting. Frankly I haven't looked at this and want to move onto the site upgrade (weekends are the slowest reader times and I have to take the site offline for long periods).
So, I hope to look at this in detail later.
Here is their spin (for now). I have to look at the definitions, details to see where this data is coming from....generally anything on labor it's like sifting through the sands, checking the datasets, extrapolating, making sure you're doing apples to apples.
But I hear ya on these people, the worst unemployment rate and I'll have to check but probably hitting the longest on record since the Great Depression and these guys cheer over jobs that don't even keep up with the population growth rate. Jez.
evidence for "reentering" discouraged workers
I keep reading that the reason the unemployment rate going up is because "discouraged workers" are now reentering the job market because they are, by definiton, no longer discouraged.
However, I haven't seen the numbers and percentage of change for discouraged workers. I know you are busy. However, if you get into the labor data perhaps you could pull out some numbers and percentages of changing discouraged workers.
Or, if anyone else has the specifics maybe they could post them.
Thank you
Where Else Did the Extra 900,000 Workers Come From?
I believe thats the correct number of new workers that entered the workforce and moved the stat to 9.9%.
However what is likely is that these were people who were out of work (and either couldn't get unemployment originally so the stat shows them as employed or they ran out of benefits so the stat shows them as employed) and found seasonal employment lost it and now have 'reentered the work force'.
The statistics are skewed to show less people out of work then the actual number but sometimes that fact creates anomalies in reporting.
No one stops looking for work if they have bills to pay although welfare and bankruptcies could be looked at to see if one follows the other. There are probably some close interactions between all those numbers.
805,000
It's not 900k. That said, if one adds up the employed, 550k, the new entrants, 34k and the re-entrants, 195k, it comes to 779k. So where are the missing 26k? I believe those are people who finished temp. jobs and they get re-added to the U-3 stats.
discouraged workers
The data is reported yearly and is not seasonally adjusted. That said, there is a good reason to upload the monthly reports and March unemployment is here and that's to compare. I started doing this because after a new report is issued, the old report disappears or at least I haven't been able to locate a report archive on many of these.
So, looking at March discouraged numbers there were 1 million discouraged. April is 1.2 million, so extrapolating that's an increase of 200,000, but not seasonally adjusted.
So, if discouraged had moved into the U-3 numbers thus to be counted in the official unemployment rate, one would have thought to see this number drop.
That said, if you look at the 3rd and 4th graphs, the civilian labor force and participation rate, plus you see I broke down some numbers there, that's how the unemployment rate increased. So, you have "re-entrants" but it's not everything. I haven't cranked the numbers to locate that 0.2% increase directly correlated to those numbers, but it's probably right.
So, you've got 195k moving into looking (re-entrant) but you've also got a huge bump up of discouraged.
In table A-11, we have a breakdown on the unemployment reasons.
The difference between March and April data is (thousands):
employment and completely temp: -108
on temp layoff: -236
on perm layoff: 129
job leavers:44
re-entrants: 195
new entrants: 34
So, it's not discouraged workers per say that the unemployment rate increased, it's the re-entrants and the new entrants and the growth in the labor force.
Notice also the drop in temp layoffs, yet the permanent layoffs increased.
Here's what I found strange, the drop out of the labor force was also high, yet the civilian labor force increased that much. The only other thing I can think of is immigration/people turning 16.
Where is the U-6 At?
I've looked and looked for this number on the web, where the latest number is kept so I can check it and can never find it.
Is there a link to that stat? Thanks
in these gov. stat posts
I almost always link to the actual data report from the government and if they do not offer permanent links to each report, then I literally download those gov. stats and upload them to this site. That's those attachments and then I link to them, almost always in the first line. (see that link in the first line? That's the actual uploaded report). (although I need to link up to the gov. agency releasing/responsible for the actual report because we're getting page ranked higher in de Google, which is very obviously wrong, but if I do that it puts readers swimming on their sites, which ya know, the point is to try to make these things less confusing. )
So, if you read the above post, I put up U-6, it's 17.1%. but it's buried in the tables A-15. Tables are always at the bottom of these reports. Then, you can also get XLS (txt too) raw data from the BLS. It's kind of a hassle. Their graphing stuff is terrible. As you probably know I used Fed. Reserve, St. Louis FRED and ALFRED online systems for graphing because it is SO COOL! I really love FRED, it's so well done, so useful.
Household survey MSM spin flaw
Ok, I found it. While the Household survey shows 550k more employed people, Let's review the BLS definition, from the Household survey of employed:
In AG jobs, which are not counted in the establishment survey, the increase was 37k. In non-AG, the wage/salaried workers is 471k, BUT, that includes people on unpaid leave. So, from what I can determine, in the household survey those counted as employed who actually weren't making any money is 114k.
This plain just doesn't add up to a direct comparison to the establishment survey. I cannot directly subtract off the results, at least from the report, to make the numbers jive.
Self-employed actually dropped 39k. 5% of the total employed are holding down more than one job. But, still, there are some other adjustments I cannot locate for the BLS to claim the number minus self-employed and AG is 382k. I suspect that's a statistical adjustment.
With that, I attached this report from the BLS explaining the differences, when things have diverged and the different sampling and data methods between the two surveys.
I suspect, strongly, it's the underground economy and a statistical error in population growth, since the Census only updates population annually. But, ya know, talkin' the number someone wants because they are a green shooter is a little ridiculous. It's obviously very difficult to get an accurate picture and I think I've said many times, I think the BLS needs to revamp their data sources and get more detailed info, larger samples, get an updated Pop. number and get it more real-time and get immigration status too. Wouldn't hurt if they counted the number of jobs created globally and where by MNCs who are officially US corporations too. ;)
Anywho, mystery solved and not.
This blog is like going to graduate school
WOW! That is some kind of analysis - thank you. This blog is like going to graduate school. I'm going to have to do my homework on these numbers. But, maybe it's not worth it in the end. As you have said before about labor statistics "they are bogus". But, you have to take what you can get.
Sadly, organized labor has the political influence in the Democratic party to bring about meaningful statistics or if nothing else hire with their own economist to produce reports that reflect labor reality. I read the labor blogs and I learn nothing about labor economy.
Are We Seeing A Depression Not Just a Dip in the Making?
This is an unsettling article. The depression in the 30's had an uptick before it really hit hard and that along the way to that there was a lot of civil unrest all over etc including the Bonus Army being evicted in DC but in general civil unrest like we are seeing and will continue to see in Greece.
Does Greece Signal A Depression?
US Banks and their actions being tied to global problems and that could have serious repercussions for us in the long run.
Financial Shockwaves Around the World
The latest market downturn could be much worse soon.
Citi Sees up to 20% Correction
This could be the 'Emperor has no clothes" moment for the worlds preferred way of doing business - borrow today and leave the bills to our children.
US business media still doesn't see much in the way of systemic harm going on with US business practices the way they are or they aren't making any statements about it but when the rest of the globe starts pointing our way it will be hard to deny.
potential for depression
midtowng should weigh in, but I'm pretty sure he'll say one is coming.
Myself, I am more thinking technically it could be a depression for a recession lasting more than 3 years is one. But, right now I'm leaning towards double dip, which (I'd have to go check the business cycle definition/experts on this), but I believe would be then classified as a depression (not sure if you can have a couple of positive GDP quarters in here). Regardless, I am not in the happy talk/green shoots camp and much I blame the government for. It's so corrupt! They absolutely throw the nation down the drain per corporate lobbyists/banksters agendas and frankly sometimes I don't think legislators even have the skills to know what they are doing. Doesn't help to have Larry Summers and Co. being the economic advisers.
the debt thing is tricky for me. I see this is a real problem but to me the original problem was they didn't do "Stimulus right" and they didn't do "bottom up" saving, i.e. the middle class. I'd say the residential real estate, refusing to plain give a haircut and reduce principle so people could stay in their homes was a major disaster.
Anywho, that's why this site exists.
The Potential is Scary
I'd like to see Midtowing weigh in on this also. I disagree with them on some things but they have well positioned arguments all of the time. I may be a devils advocate here much of the time but its not from a lack of respect on my part for the other posters.
Your mention of corruption in government is timely for me, the FBI is popping RI pols left and right recently.
My own belief is that government corruption is so under investigated that it has nearly free reign with only the most blatant abusers ever smoked out in the open. My take is that when everyone can see something is rotten the only thing hindering a crime is the lack of investigation. The FBI, DOJ and the regulatory agencies probably need a 1,000% increase in funding just to keep up with political crimes related to kickbacks and purchased votes on both sides of the aisle.
Its a sad state of affairs.