
The media and stock market are insane. This is why. Today, AP reported the stock market, seemingly on a daily 500 point roller coaster, increased due to initial weekly unemployment claims. Don't they realize every week, the previous week is almost always revised upward?
Initial weekly unemployment claims decreased to 395,000, a reported drop of 7,000. Yet, last week was revised upward 2,000 from 400,000 to 402,000. Why anyone would get so excited with an initial claims still close to 400,000 and a 4 week moving average above 400,000, now at 405,000, is beyond me. A weekly average above 400,000 does not indicate job growth.
Initial claims is a volatile number and one must at minimum, look at the 4 week average to ascertain any sort of pattern. One week of better news does not an improving job market make.
The magic number to show job creation is at minimum, below 400,000 initial unemployment claims, per week. Most Economists will quote 375,000 as the magic number to indicate job growth.
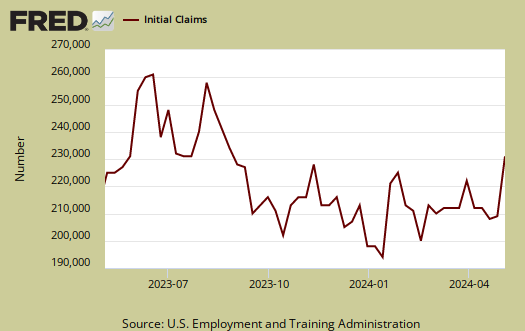
Below is the mathematical log of initial weekly unemployment claims, so one can get a better sense of the rise and fall of the numbers. A log helps remove some statistical noise, it's kind of an averaging. As we can see we have a step rise during the height of the recession, but then a leveling, not a similar decline....for a long period. Instead, we have this yo-yo bobblehead, hovering around 400,000 every week on initial claims, never ending labor malaise for most of the time after the recession ended in July 2009. Now, notice the tail or the right of the graph, it appears an upward slope, an increase in initial claims, which started to emerge in February.

Below is the 4 week moving average, set to a logarithmic scale to remove even more statistical noise, for the last year. Again, we need the 4 week moving average to stay below 400,000 and keep dropping. Numerous economists say the number is 375,000 to show any job growth. We need this number to keep dropping, steadily.

Below is the 4 week moving average, set to a log scale, from April 1st, 2007. We are nowhere near pre-recession initial weekly unemployment claims levels.
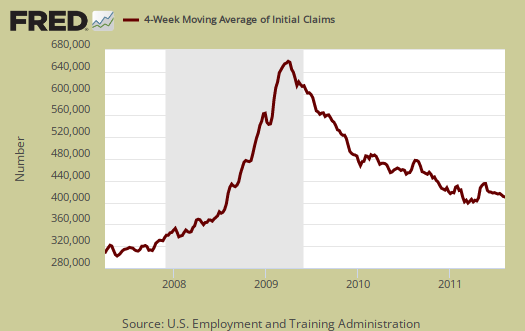
So, while today's report was an improvement over recent months, one can see the graph slope is not accelerating and is still above even earlier this year! See any blow out job growth earlier this year? See any 375,000 initial claims averages since the start of the recession?
Even worse, the press completely ignored the trade deficit, which had strong implications that Q2 GDP growth will be revised significantly downward. Since when is GDP < 1% a reason to cheer and rock the stock market DOW 500 points?
Continuing unemployment claims dropped but bear in mind people can plain being running out of benefits.
The advance seasonally adjusted insured unemployment rate was 2.9 percent for the week ending July 30, a 0.1 percentage point decrease from the prior week's unrevised rate of 3.0 percent.
The advance number for seasonally adjusted insured unemployment during the week ending July 30 was 3,688,000, a decrease of 60,000 from the preceding week's revised level of 3,748,000. The 4-week moving average was 3,718,750, a decrease of 15,250 from the preceding week's revised average of 3,734,000.
In the week ending July 23rd, not seasonally adjusted, the raw number was 7,479,915 official people obtaining some sort of unemployment insurance benefit.
Gold fever breaking?
"Why anyone would get so excited [about UI claims report] is beyond me ... Even worse, the press completely ignored the trade deficit ... Since when is GDP < 1% a reason to cheer and rock the stock market DOW 500 points?" -- Robert Oak
The "press" is mostly a gang of lumpenproletariat idiots. IMHO, the real news is that gold fever appears to be breaking, for now.
last gold est. high was $2100/oz.
Last gold high projection I saw was $2100/oz. I think it will go higher, despite the records.
I'm not going to bet on it either way
You may well be right. The question is within what time frame? I think if gold goes higher to $2100 this month, then the DOW will go lower this month. If gold goes higher to over $2000 later this year and appears to settle in, say at $2100, the DOW might stay steady even in a relatively slow economy. Blue Chips as MNCs and as real capital investment should be a hedge against $$$ inflation just as gold should be, but nothing in the financial world makes much sense these days. (Oh, I know, it can all be rationalized!)
CME raised Gold margins by 22%
Business Insider, 12 August 2011 (Lior Cohen, Trading Nrg)
What is the bounce, the roller coaster, all about? What does it do? On the downswing, it squeezes out small players hoping to leverage buys on margin, that's what it does. On the upswing, it cleans out short players. If your computer is smart enough, or if you don't care about anything but trading volume, you make a very good living all the way up and all the way down and all the way back up again, and so on.
For many, it isn't so much that they want to hold gold as it is that they want to take advantage of margin to leverage the next uptick in gold that they consider to be 99.9999999% certain. Why not? .... well .... because an overall trend doesn't make a monotonic graph .... and if or when volatility hits gold again, your calculations about your margin play become very different .... no more 99.9999999% certainty.
This doesn't mean that gold will EOY be above or below $1800 or $2000 (whatever your projected 'goal' may be), it just means that gold fever may be breaking. It's difficult to evaluate, however, because it's become a religious issue. Gold is a matter of religion. There's no other way to explain Ron Paul blandly indicating that the goal for gold is $5000 or $10,000. Such statements, although probably true over a long enough time period, are religious rather than rational in nature. Do we have any doubt that when markets open on Judgment Day, gold will be quoted at exactly $666K per troy ounce?
Suppose you have $$$$. You can buy gold at current prices on margin with "expectation" of net 10% gain by EOY (if you are solid on calls and/or certain there will be no fluctuation). On the other hand, you may also be able to buy equity shares paying 100% at or near a low with "expectation" of net gain by EOY of 10%, possibly more than 10%. However, what you are really thinking is about people who bought AT&T in 1933. Or you are thinking as an investor about an earnings stream over the next few years and behond. (What? Investors? Aren't there just players anymore?)
For true believers, there is no comparison between these two alternatives, no basis for rational comparisons. To buy gold and hold gold is the whole of financial wisdom. No more tough thinking required. You know the one and only way to $$$alvation. Others continue to hold deversified portfolios, 401Ks, IRAs, and so on, but you see all of those as toxic assets.
Of course, everyone is bullish long-term on gold and no one feels safe without it. That's not the same thing as the current gold fever. For those who are not true believers in the Gold Cult, the chance to leverage plays thanks to margin offered by precious metals dealers is the primary attraction when considering buying gold.
A major cause of volatility in equity markets, IMO, has been the margin available in precious metals markets, causing investors to prefer gambling in gold over investments in commerce, because of the appearance of both zero risk and certainty of profits in gold. The player mentality takes over and "long-term" comes to mean today and tommorrow up until the last hour. Anathema to the Gold Cult is the idea that slowly a trend settles in as investors identify attractive long-term equity buys as realization retiurns that gold, as such, returns no earnings whatsoever, and is really just another commodity (no more sacred than, say, aluminum or petroeum).
Of course, there are also the hard-bit cynics who aren't taken in by the Gold Cult but are convined (a) that resources generally are running short as population continues to increase, and, (b) that there will be no earnings at all for many, many years to come ... like until Ron Paul occupies the White House in the midst of hyperinflationary collapse of the economy.
IMO, the Internal Revenue Code should simply tax profits made from plays on margin in precious metals as what they are -- profits from gambling.
Just my 2¢.
Ah, implies it's a real bubble
They raised margins I believe on Internet stocks at one point in the dot con bubble, it implies something is a bubble, or is being targeted as a bubble.
That would explain the drop, but gold bugs know no bounds and I don't have any news the Europe bond threat is over or addressed. Lots of band-aids, which I've put up in Instapopulists.