April New Residential Single Family Home Sales increased 2.3% to 454,000 in annualized sales. New Single Family Housing inventory is at a 4.1 month supply. New single family home sales are now 29.0% above April 2012 levels, but this figure has a ±20.7% margin of error. A year ago new home annualized sales were 352,000. Sales figures are annualized and represent what the yearly volume would be if just that month's rate were applied to the entire year. These figures are seasonally adjusted as well. Beware of this report for most months the change in sales is inside the statistical margin of error and will be revised significantly in the upcoming months.
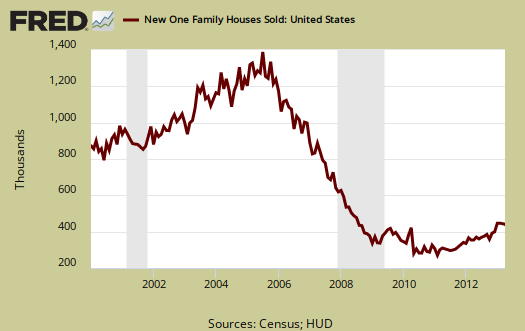
New homes available for sale increased 3.3% from last month. The average home sale price was $330,800, a 15.4% jump from last month's average price of $286,700. These prices are clearly outside the range of what most wages can afford. From April 2012, the average home sale price has increased 14.9%, which implies prices might be starting to really soar.
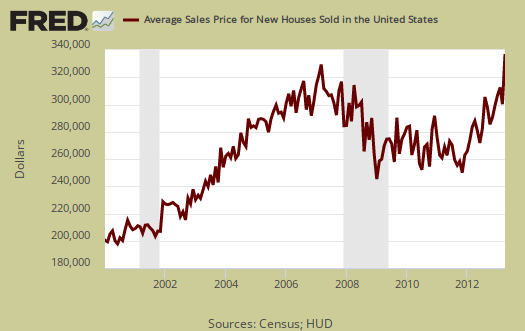
March's median new home price also jumped by 8.3% to $271,600. From April 2012, the median new home sales price has also increased by 14.9%. Median means half of new homes were sold below this price and both the average and median sales price for single family homes is not seasonally adjusted. These are price jumps of just one month's time, which is incredible if one thinks about the potential new home cost increases over a year.
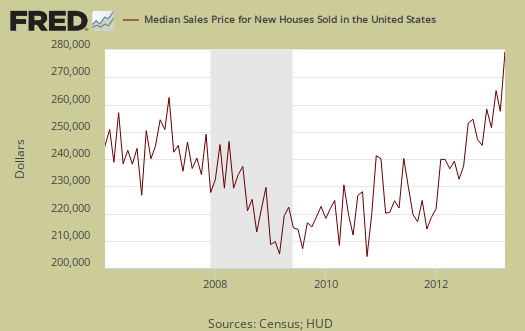
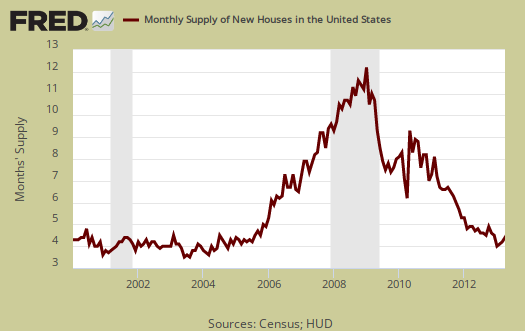
Inventories had no change from last month. The current supply of new homes on the market would now take 4.1 months to sell. From a year ago housing inventory has declined -16.3%. Inventories are clearly at record lows, as shown in the below graph.
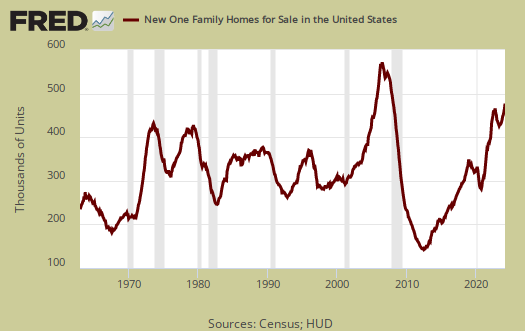
Below is a graph of the months it would take to sell the new homes on the market at each month's sales rate. We can see these inventories vs. sales times have plunged.
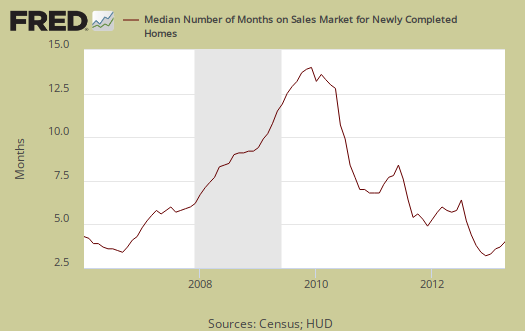
The median time a house was completed and on the market for sale to the time it sold was 4.0 month. The media time a house was completed and then sold has also plunged. Additionally, the last three months were revised downward.
The variance in monthly housing sales statistics is so large, in part, due to the actual volume declining, along with the fact this is a survey. One needs to look at least a quarter to get a real feel for new home sales, but a year of sales data is more in order. Additionally this report, due to it's huge margin of error, is almost always revised significantly the next month. Buyer beware on month to month comparisons and reacting to primarily figures and why we graph up the statistics so one can identify a real trend versus press headline buzz.
What we know for certain about new homes sales are increasing and the costs are skyrocketing from the year ago change. We also know inventories have plunged. New single family home prices becoming out of reach for most families by income once again. This is not a healthy housing market to simply return to new home prices people cannot afford and is one of the reasons subprime started in earnest a decade ago. We list the margins of error for they are usually above the monthly reported percentage changes. The Census notes that the average revision is about 5% of the original reported.
Here is our overviews of residential real estate statistics, only some graphs revised.

neanderthal data collection methods for this one
ie, voluntary responses to survey
and
Census field representatives use interviewing software on laptop computers to collect the data
(and)... visit a sample of permit offices and select a sample of permits issued for new housing
http://www.census.gov/construction/nrs/how_the_data_are_collected/
no wonder there's a 20% margin of error..
rjs
true but the housing market
is completely out of balance with the economy again. What happened to those millions of foreclosures? Have to check what is the state of housing being kept off the market.
last i saw
was that it is on the order of 90% of REO still being held of the market; here's one article on that: http://www.counterpunch.org/2013/02/19/theres-still-a-foreclosure-crisis/
rjs
same here, 85% to 90^ REO being held off market
But the data is old, we covered that when it came out, now about a year ago. Seems they are making sure inventories are at record lows to boost up housing prices. I'll see what I can dig out that is statistically fresh.
more recent data
bill mcbride covered the most recent FDIC report, which has data on dollar value of REOs, which look to be going down, but are still well above normal...
http://www.calculatedriskblog.com/2013/05/fdic-reports-record-earnings-f...
i continue to watch the monthly LPS Mortgage Monitor...earlier this month, its release coincided with the release of the MBA mortgage delinquency survey, so i covered the same data from two sources; we still have 1 in 10 homeowners not paying on their mortgages, and the banks are not taking the foreclosed homes back anymore; the average length of time for those in the foreclosure process has lengthened to 834 days nationally; that makes for a large shadow inventory...
http://marketwatch666.blogspot.com/2013/05/the-mba-lps-on-mortgage-delin...
rjs
marketwatch 666 is you?
That's your site?
If so, you know we do cross posts if you're interested, although you need some paragraph separators, ;)
834 days, unbelievable, so between that and the Fed QE we have a very nice bubble blowing I think.
Bill, generally is data driven, rationale (most of the time).
it's mostly mine..
marketwatch 666 is a team blog i set up september 2009 for a dozen friends who were posting their work on the censored forums at rupert murdoch's marketwatch...most have either since set up their own blogs or quit posting, but i kept using it to keep all my writing in the same place...
what i'm doing there now is primarily a once a week summary of highlights of the topics i cover (economics, energy, & the environment) - generally i write it on saturdays, email it sunday morning, & by sunday evening add clarifying links & post it online...most of my time during the week is still spent on my weekly aggregator, the globalglassonion ( http://globalglassonion.blogspot.com/ ) which is where most of the links i use on my sunday summary are sourced from..
i've always been willing to let anyone republish anything i've written - copyright rejected...most probably would reject my syntax, lack of capitalization, & run on sentences...dan at angry bear has used paragraphs of what i've written several times, and each time he's done so he's "edited for clarity"....you are free to do the same; if you want, although many of the topics i cover on the weekend are those you've already covered earlier in the week...
rjs
Ah, EP needs quality writers
We've had people come and go and between the site redesign and a "hot project" that I was working on 24/7, the traffic has died down. We need a 100% no corporate media financial/economics site, which this has been known for. But it's tough to write quality articles solo.
i'll see what i can do
i learned to write from beatnik poets, so i understand that most readers are likely unconfortable with my natural style...but i can, with some effort, edit myself to make what i've written comform to a modest version of American prose; something i've done in the past for guest posts on environmental topics on angry bear....
if i have something that i think might be suitable for use here, i will let you know...if you then decide you'd want to use it, i will then edit what i have for readability, & send the edited version to you for final approval..
rjs
missed that contact captcha 8 times
you may want to use the longish paragraph i wrote on income and outlays...of course, it would have to be "edited for clarity"...
rjs
will check
I'll check the CAPTCHA, lots of problems with spammers, but that particular one gets buggy sometimes and fails. Thx.
Don't post addresses as harvesters will pick them up in 30ms.
Will check the email, but you can just email directly, no need to use the content form once I had a conversation, also, if you're logged in there is no content form (or should not be) and one can email individuals via the system on the site.
Going up and hope it will continue
The graph shows a great sign of recovery and that's good for the industry to recover.
back on topic
yves smith has an excellent post on "investors" buying up houses this morning:
http://www.nakedcapitalism.com/2013/05/so-who-is-the-dumb-money-ruining-...
rjs
excellent real estate statistics digging!
All cash buyers is still high but on NAR stats they claim first time home buyers are at 33% or so, which is very hard to believe.
But Las Vegas is magically "on fire" again when their unemployment rate is still very high and it was such a housing bubble, way overbuilt area, highly suspect for their recently gains in prices.