This morning the BLS reported that consumer inflation increased +0.1% (seasonally adjusted) in May, (rising 0.3% non-seasonally adjusted). Year-over-year prices have fallen -1.3% into deflation. YoY consumer deflation is only surpassed by 1949 in the post-Depression era.
The first 5 months of inflation data are still in accord with the optimistic scenario I laid out in January:
In the Optimistic scenario, the fiscal and monetary stimuli, together with intelligent new political leadership in Washington, halt the meltdown perhaps by mid-year, and wage reductions remain the exception. In the Pessimistic scenario, the stimuli fail, and wage reductions spread, leading to a wage-price deflationary spiral.
In the Optimistic scenario, monthly inflation remains positive, but perhaps at 1/3 to 1/2 the level of last year. By the end of June, first half 2009 inflation will be in the 1.4%-2.2% range. Year over year, however, as the 2008 numbers are replaced, DEflation will be realized, falling to (-2.0%) - (-2.7%) range....
In the Pessimistic scenario, monthly inflation remains near 0%-1% in the first half, and is firmly negative, though less than 2008 in the second half. By mid-year, YoY DEflation will be somewhere in the (-3%) - (-4.5%) range....
Five months later, NSA inflation for 2009 so far is +1.4%. Nevertheless, if there were to be a recovery soon, we would need PPI for commodities to bottom and turn around. That hasn't happened yet.
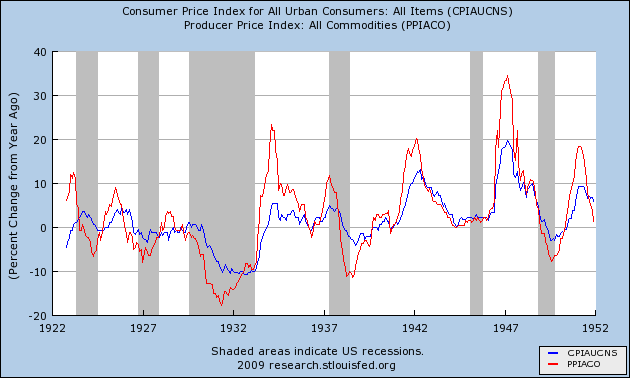
A bottom and turning around of inflation data would generally mean increased demand. So far that is not happening. For comparison, here is the consumer and commodity inflation data during the deflationary 1920-1950 era:

Note that commodities (in red) almost always turned up before the economy as a whole did. Typically CPI (in blue) bottomed on a year-over-year basis at the end of deflationary recessions, including the Great Depression.
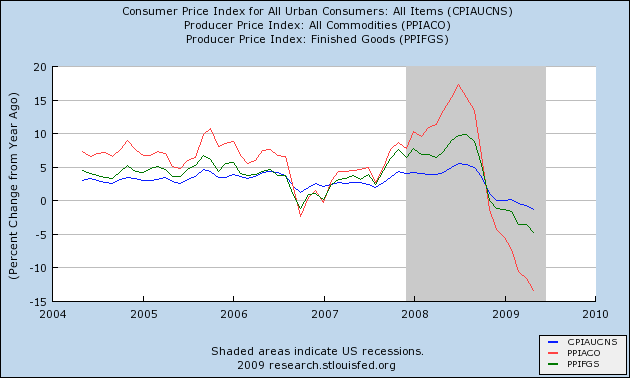
Now here is the same graph for our current deflationary downturn, plus PPI for finished goods (in green: this series was not kept before WW2):

There is no sign yet of the rate of commodity price changes turning towards the positive, year-over-year. That is likely to change by August, when the comparisons will be to the collapse in commodities that started after last July 4. That is one reason why there is a legitimate optimistic scenario whereby this recession (or this leg of a "W" shaped recession) will bottom before Labor Day.

Comments
ya know I'm reading this
and then thinking about my own experience. Everything around me has increased in price and it's bad, esp. health insurance.
If I didn't read EIs and the indexes you couldn't prove deflationary anything to me!
On the industrial production side, I also noticed that raw metals, i.e. mining was way down in capacity. I believe that should have affected a few commodities in terms of price, correct?
Check the secondary market
And you'll see deflation. Craigslist is becoming simply amazing- especially in the luxury yacht market for some reason, with short sales or people trying to get out of marina fees pushing the price down below $8000, but banks using Craigslist also to try to recover money from similar but newer yachts at $75,000+.
You can tell people are getting desperate for the shortage of money- and that's going to hit retail eventually.
-------------------------------------
Maximum jobs, not maximum profits.
-------------------------------------
Maximum jobs, not maximum profits.
Me too
There is not one thing that is part of my daily living experience that is going down in price. Oh, eggs did come back down from a spike during last years gas increase. Is coming back down from a spike counted as deflation?
These continue to rise.............
My electric
My phone
My natural gas
My gasoline
Almost all food
Water
Etc.
Hm water? Opened up my financial application and see that on 1/11/1992 my water invoice was $13.11. In May 2009 that same water company invoice was $37.00. That is a three hundred percent increase. I was in my forties in 1992 and sadly my income has not increased by 300%.
It is the same for most all of the daily living needs.
So I am looking for the deflation but just don't see it. I have seen wage deflation.
Click on the BLS link in the story
and look at their chart. Food, recreation, housing, and a few other items have been coming down in price over the last 3-6 months. And yes, coming down from a spike does count as deflation.
The graphs I have used above are year-over-year. Energy costs are the biggest, but not the only, change.
SO they say but the odd part is I haven't seen it
and my friends and neighbors have not seen it. My friend that owns a mid-size market tells me her accounts payable on inventory have not gone down.
At this moment in time, I could use a bit of lower prices.
I've seen it
But *ONLY* in the secondary marketplace- lower prices on food at direct-from-the-farmer markets, lower prices in the used market where people are trying to unload assets that have maintenance costs or high running costs.
The value of 3-year-old 15 passenger vans is dropping like crazy- saw one for $600 the other day.
Same with luxury yachts from the 1980s and earlier.
I suspect we've got some burn time on overproduced Chinese Imports before we see cash-strapped retailers cutting prices.
-------------------------------------
Maximum jobs, not maximum profits.
-------------------------------------
Maximum jobs, not maximum profits.
personal experience vs. macro economics
Seebert, I notice a pattern. You comment on what you personally witness, instead of looking at the economic indicators, the big picture.
While I am scratching my head, one needs to dig deeper into CPI, inflationary indicators, etc. to see why one's personal experience is divergent from from the statistics....
but personal experience does not equal overriding the macro economic data.
So, the question is why, with so many of us talking about massive rising prices in our personal lives....is the CPI down? That's the real question.
For example, beater cargo vans on craigslist and luxury yachts do not really have much impact on the overall retail markets. Food sure does, energy prices do, etc.
Seebert has a point
While there are natural flaws in drawing conclusions about the world from personal experience, the fact is that official government numbers cannot be trusted anymore for a multitude of reasons.
Perhaps the best reason not to trust them is because they are almost always too positive, and then get revised downward only months later when no one is looking.
The CPI is probably the most manipulated stat of all.
right but.....
why are the two divergent? In Macro economic world the personal experience counts for zero. What the hell is going on, specifically which is making not just Seebert's personal observations, but I mentioned my own personal experience, you did too....how is this so divergent? What element in the CPI is missing, what the hell is going on here?
I'm personally getting screwed royal at a time I cannot afford it at all.
but to talk about it on a macro economic level to challenge these deflationary indicators, we need to find out precisely where things diverge....how can this be?
I'm not explaining myself very well
In CPI/PPI terms, *retail market is a lagging indicator*. I noticed this years ago with hard drives at Wal*Mart- unless something *forces* a retailer to lower prices, the prices will not be lowered- EVEN IF THE REST OF THE MARKET IS. I'll skip the hard drive story to explain the mathematics (boring anyway- just a matter of outdated stock not dropping in price with the rest of the market).
The three things the force a retailer to lower prices are:
1. Competition- perceived or real loss of market share.
2. Inventory taxes- getting stuck with excess inventory at the end of the year.
3. Cash flow problems- not enough demand to keep up with overhead.
In a wage/price deflationary spiral, overhead for *big* retailers shrinks, and so they avoid cash flow problems. Small retailers, manufactures, and individuals have overhead too, but that overhead is largely fixed.
So any deflationary spiral is going to hit the used/mom&pop market first- until #1 kicks in, the perceived loss of market share. Otherwise, deflation just means more profit for middle men and retailers, who won't lower their prices until the lack of demand catches up with them.
Thus the divergence point- your local retailer and his supplier taking profits while they can, until competition catches up with them.
-------------------------------------
Maximum jobs, not maximum profits.
-------------------------------------
Maximum jobs, not maximum profits.
A long the retail line, keep
A long the retail line, keep in mind that with suppliers/producers of "essentials" is that they will not lower their prices unless their sales volumes fall.
When the stock market crashed last fall, and the news was made official that the US had been in a recession since Dec 2007, I started looking for recession-resistant companies/stock.
As a matter of fact, some of them, such as Alberto-Culver,hair care products, and Clorox, cleaning products, were *raising* wholesale prices as their commodity prices were falling as they believe the market will bear the increases, thus increasing their profit margins -> yield ->stock price.
"Big picture" economics may force them cut margins eventually, but I haven't seen that yet.
more on CPI
This is on the Atlanta Fed blog, where they are breaking down the entire CPI to look for skew which won't show up in the median numbers.
I'd say NDD you're getting a lot of validation on worrying about deflation from reading the more detailed analysis of some of the more "hard core" economics blogs.
Very interesting graph noted by the Atlanta Fed.