
The BLS reports on individual occupations and wages. This is a separate survey from the employment report and unfortunately there is significant lag in the breakdown of 800 different specific job categories from the current overall employment statistics. While waiting for the March unemployment report to be dissected and digested, it might be of interest to look at the most recent occupational survey statistics from the BLS. For May 2011, 10 months ago, we have some seriously crappy jobs dominating the labor market.
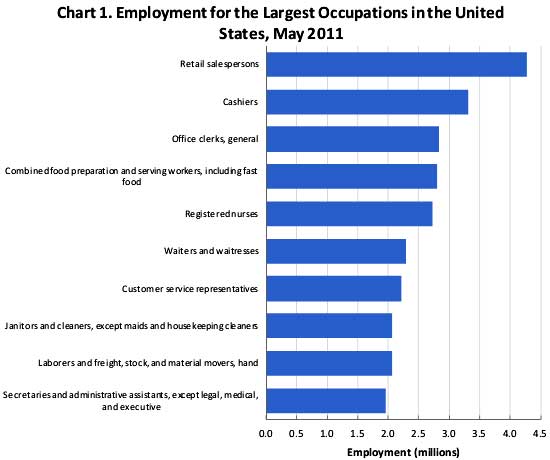
The two largest occupations were retail sales clerks and cashiers. These two job titles make up a whopping 6% of total occupations. After retail sales people, then cashiers, the next largest occupations where general office clerks, food preparation and serving, registered nurses, waiters and waitresses and customer service representatives. The above BLS chart describes the top 10 occupations in the United States for May 2011. Notice, except for nurses, these are all crappy jobs, below the average wage.
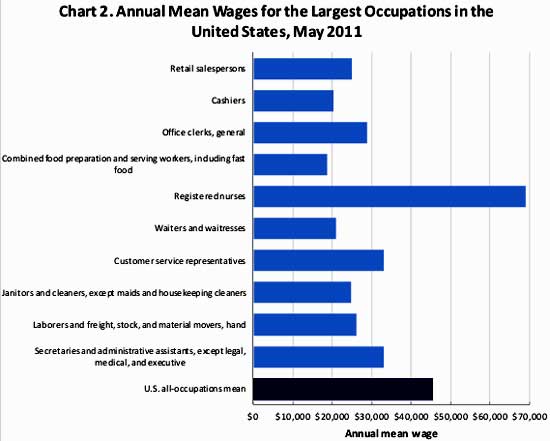
Of the 10 largest occupations, only registered nurses, with an annual mean wage of $69,110, had an average wage above the U.S. all-occupations mean of $21.74 per hour or $45,230 annually. Annual mean wages for the rest of the
10 largest occupations ranged from $18,790 for combined food preparation and serving workers to $33,120 for customer service representatives.
Below is the table of the top occupations, their percentage of total employed, their hourly wages and annual salaries. Depressing isn't it? Look at how many top occupations are making annual salaries below $30k a year. These wages are not exactly enough to buy a home and put a kid through school, never mind buy food and make rent.
| Employment and wages of the largest occupations, May 2011 | ||||
| Occupation | Percent of Jobs | Employment | Hourly | Annual |
| Retail Salespersons | 3.3% | 4,270,550 | $12.08 | $25,130 |
| Cashiers | 2.6% | 3,314,870 | $9.73 | $20,230 |
| Office Clerks, General | 2.2% | 2,828,140 | $13.90 | $28,920 |
| Combined Food Preparation and Serving Workers, Including Fast Food | 1.1% | 2,799,430 | $9.03 | $18,790 |
| Registered Nurses | 2.1% | 2,724,570 | $33.23 | $69,110 |
| Waiters and Waitresses | 1.8% | 2,289,010 | $10.05 | $20,890 |
| Customer Service Representatives | 1.7% | 2,212,820 | $15.92 | $33,120 |
| Janitors and Cleaners, Except Maids and Housekeeping Cleaners | 1.6% | 2,068,460 | $11.94 | $24,840 |
| Laborers and Freight, Stock, and Material Movers, Hand | 1.6% | 2,063,580 | $12.62 | $26,240 |
| Secretaries & Administrative Assistants, Except Legal, Medical, & Executive | 1.5% | 1,955,570 | $15.87 | $33,020 |
| General and Operations Managers | 1.4% | 1,805,030 | $55.04 | $114,490 |
| Stock Clerks and Order Fillers | 1.4% | 1,782,800 | $11.66 | $24,250 |
| Bookkeeping, Accounting, and Auditing Clerks | 1.3% | 1,643,470 | $17.37 | $36,120 |
| Heavy and Tractor-Trailer Truck Drivers | 1.2% | 1,508,620 | $19.15 | $39,830 |
| Nursing Aides, Orderlies, and Attendants | 1.1% | 1,466,700 | $12.22 | $25,420 |
The report also lists the lowest paying jobs in the United States. Notice how many of the top occupations are listed below:
The lowest paying occupational groups were food preparation and serving related; farming, fishing, and forestry; personal care and service; and building and grounds cleaning and maintenance occupations. Annual mean wages for these groups ranged from $21,430 for food preparation and serving related occupations to $25,560 for building and grounds cleaning and maintenance occupations. Nearly all of the individual occupations in these groups had below-average wages. For example, chefs and head cooks was the only food preparation and serving related occupation with a mean wage above th e U.S. all-occupations mean, and 15 of the 18 occupations in this group had annual m ean wages of $25,000 or less.
The monthly employment report does give payrolls by larger categories, such as retail trade and leisure, hospitality, which does give a broader implication of what kinds of new jobs are being created in 2012. For example, the retail trade sector hires many retail sales clerks. From the occupational report we see 60% of those retail trade jobs are low paying occupations.
More than 60 percent of retail trade employment was in just 4 occupations: retail salespersons, cashiers, stock clerks and order fillers, and first-line supervisors of retail sales workers.
Another example of a broad employment category is food services & drinking places. That broad employer category hires many waitresses, line cooks, fast food counter help and other very low paying jobs. We'll be breaking down payroll growth in these categories with the March employment report release, later today.
The BLS occupational employment statistics has additional tables where you can look up what the mean wage for your occupation is or for more detail, state and metropolitan area wages per occupation and the highest paying occupations.
Comments
crappy jobs
This overview explains itself from the BLS. It's just a matter of you all looking over the occupational statistics, plus going to the links to help you navigate through the BLS site on occupation. It's very seriously depressing, but also take a look at their overall tables. The next time you hear something that sounds like fiction about jobs, check out these occupational numbers for it puts occupations in scale. For example, 71k computer hardware engineers is simply a drop in the bucket in terms of America's jobs crisis and claiming growing those jobs (of course they want to fill them with foreigners) is oh so critical, think about the scale. Are 100 more computer engineers gonna scale and hire 1 million advanced skilled manufacturing workers (or train those additional 1 million in advanced skilled manufacturing?) No, not when MNCs insist on manufacturing in China it doesn't.
Additionally, check out the salaries and compare those to skills, the level of difficulty on some of these jobs. Take again computer hardware design. That is one tough skill and many who have degrees in the topic simply cannot master processor design, it's just highly complex. Yet their salaries are matching other skills areas which take less raw brain muscle and training. That shows some labor arbitrage for that result to happen to lower wages overall. In other words, the damn BLS again counts foreign guest workers as US workers and it seriously over inflates the occupational statistics and distorts the opportunities for Americans.
I'm just using one example but use these occupational statistics as a reality check against the pundit rhetoric and jobs propaganda you hear spewed about. Also, if you hear lobbyists screaming "shortage" yet overall wages are static or lower, that's an indication of labor arbitrage. If there really was a shortage wages would go through the roof as employers bid up wages in trying to retain those skills areas.
Crappy Jobs Growing and Good Jobs Lost
The point of crappy jobs growing is well taken. When the well touted manufacturing rebound started, GE and GM started paying people on the lines $12-$14 per hour. In the 40s to the 60s, production workers could buy hunting and fishing lodges on the lakes with a lunch bucket job. In today's way of looking at things, only college
grads are entitled to a living wage.
Well below what they used to pay. In the mean time, the IT domestic worker has seen his share of the STEM jobs shrink from 90 per cent to 15 percent according to the USDOL stats. I can attest that rates for STEM are 80 percent of what they were in 2000.
They will remind you that you are lucky to have a job, never mind a good one. How many of them would get up at 5:00 and take 3 trains for a job? But that is the kind of thing it takes to hold down any kind of job. The good jobs are some of the crappiest.
working on it, March payrolls
I am working on some details from March payrolls to see where we stand with crappy jobs as overall job growth. Bear with me, this is hand crank time and additionally, the damn BLS statistics are so noisy, have so much error, to me at least, one cannot take one month's of data at all and say too much. Then, we have our "summer winter" this year which is lookin' good to have thrown off the seasonal adjustments.
Anyway, I will replace this comment with a link to the new post when I get it published.