
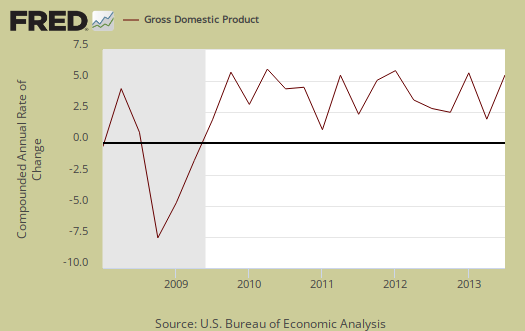
Q3 2013 real GDP came in at 2.8% Changes in business inventories saved the day as did less of an increase in imports. Fixed investment also increased. Government spending declines were about the same as Q2, yet local governments increased spending. Consumer spending was less growth than Q2, only about 37% of this quarter's GDP. Generally speaking, don't expect a 2.8% Q3 GDP to last as it is common for imports especially to be revised as more trade data comes in. Another factor to consider is the sharp jump in the price index which is used to remove inflation from the GDP figures. Q2 GDP was 2.5%.
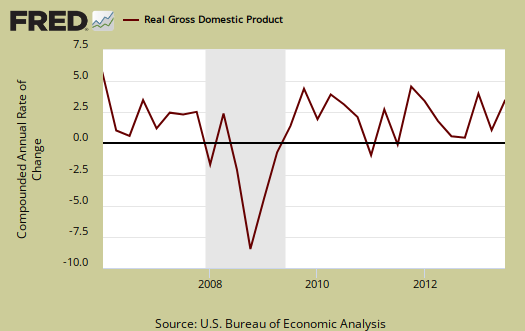
As a reminder, GDP is made up of: where Y=GDP, C=Consumption, I=Investment, G=Government Spending, (X-M)=Net Exports, X=Exports, M=Imports*. GDP in this overview, unless explicitly stated otherwise, refers to real GDP. Real GDP is in chained 2009 dollars.
The below table shows the percentage point spread breakdown from Q2 to Q3 GDP major components. GDP percentage point component contributions are calculated individually.
| Comparison of Q2 2013 and Q3 2013 GDP Components | |||
|---|---|---|---|
|
Component |
Q2 2013 |
Q3 2013 |
Spread |
| GDP | +2.49 | +2.83 | +0.34 |
| C | +1.24 | +1.04 | -0.20 |
| I | +1.38 | +1.45 | +0.07 |
| G | –0.07 | +0.04 | +0.11 |
| X | +1.04 | +0.60 | -0.44 |
| M | –1.10 | –0.30 | +0.80 |
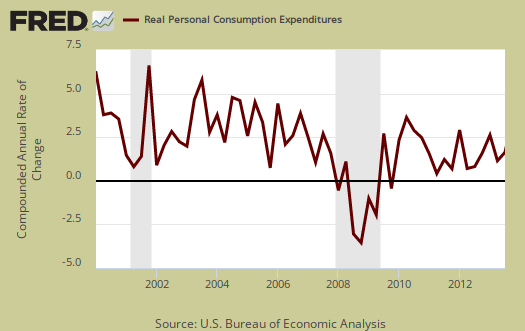
Consumer spending, C in our GDP equation, shows less growth than Q2. In terms of percentage changes, real consumer spending increased 1.5% in Q3 in comparison to a 1.8% increase in Q2. Most of consumer spending, was in goods, which added 99 percentage points to GDP growth contribution. Services within consumer spending only added 0.05 percentage points to GDP with housing and utilities subtracting -0.28 percentage points. . Below is a percentage change graph in real consumer spending going back to 2000.
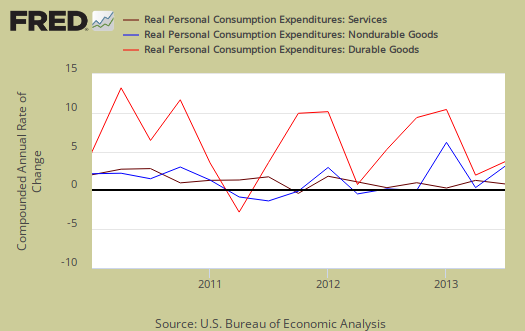
Graphed below is PCE with the quarterly annualized percentage change breakdown of durable goods (red or bright red), nondurable goods (blue) versus services (maroon).
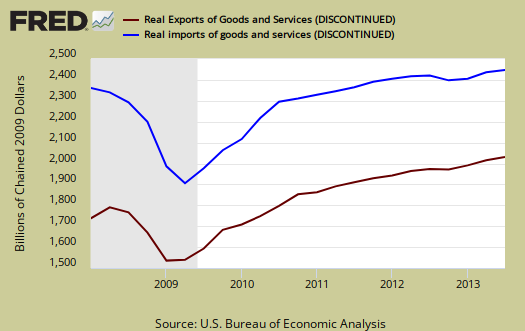
Imports and Exports, M & X added 0.3 percentage points to Q3 GDP as imports grew less than Q2 . Trade deficits subtract from economic growth.
Imports in the past have been notorious to be revised upward significantly. The September trade data has not been released and is thus estimated for this advanced Q3 GDP estimate. The shutdown also delayed the release of the September trade figures. Finally, the way GDP is calculated was significantly changed and the link reviews these changes as well as the validity of them. As if the validity of GDP is in question isn't enough, there is an agenda to classify offshore outsourcers as domestic manufacturers.
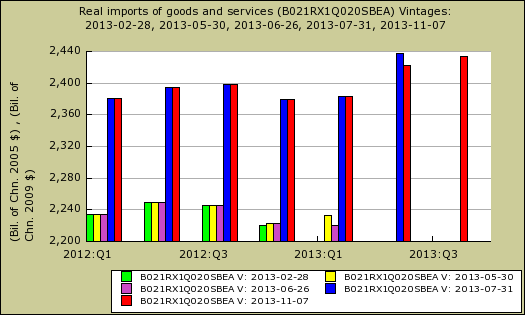
Below is a graph of import revisions. The blue, and red represent the real imports after the major changes to the way GDP is determined, overviewed in the above link. Each color represents the value of real imports on a particular release date of the GDP report and as we can see, generally speaking imports are revised significantly between the advance GDP estimate and the next revision. This is why one shouldn't bank on imports continuing to save the day for Q3 GDP.
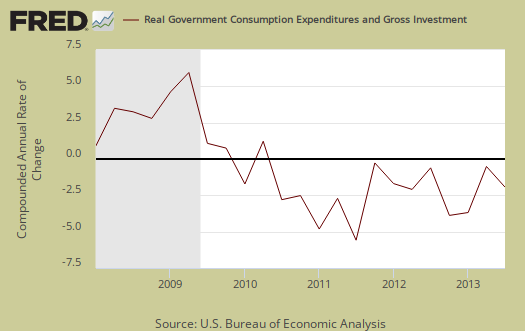
Government spending, G was +0.4 percentage points of Q3 GDP. Federal spending is still contracting with a negative 0.13 percentage point contribution. State and local, on the other hand, contributed 0.17 percentage points to Q3 GDP. Below is the percentage quarterly change of government spending, adjusted for prices, annualized.
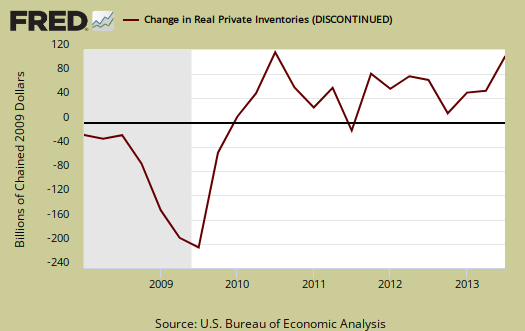
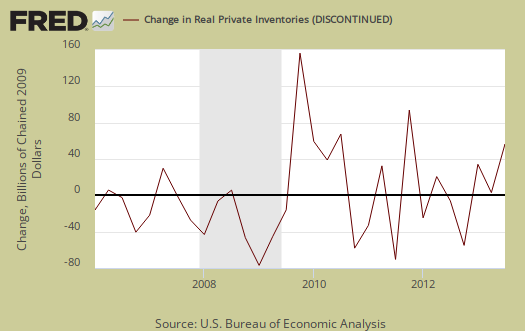
Investment, I is made up of fixed investment and changes to private inventories. The change in private inventories alone gave a +0.83 percentage point contribution to Q3. Changes in private inventories in Q2 were a 0.41 percentage point contribution to GDP. Below are the change in real private inventories and the next graph is the change in that value from the previous quarter.
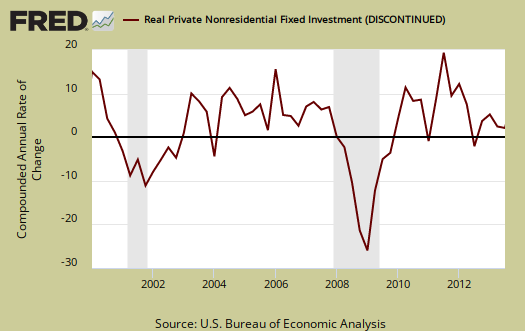
Fixed investment is residential and nonresidential and is still a bright spot in the Q3 GDP report, but not as much as it was in Q2. Overall, fixed investment contributed +0.63 percentage points to GDP. Nonresidential only added 0.20 percentage points, although structures, part of nonresidential investment, added 0.32 percentage points to GDP.
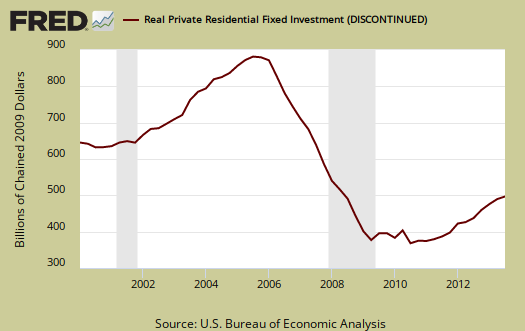
Part of fixed investment is Residential fixed investment. Residential contributed +0.43 percentage points to Q3 GDP. One can see the housing bubble collapse in the below graph and also how there is no meteoric recovery in terms of economic growth, but a modest one, for the last three quarters, in spite of all of the housing talk . Still, almost half a percent added to GDP growth ain't too shabby and shows how the residential real estate market impacts overall economic growth.
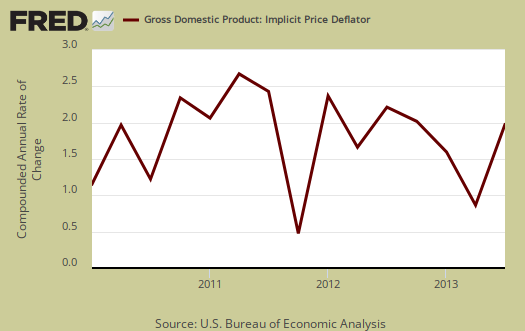
The price index for gross domestic purchases, was 1.9% for Q3 in comparison to 0.6% for Q2. Now we have a bone to pick on the price index. Their text states the price index, but for domestic purchases was 1.8%, so the question is did import prices soar? The price index is incredibly high and a good 0.5 percentage points above what one would expect from other annualized figures. There is also difference in the core price index, or the deflator excluding food and energy. The core price index increased 1.4% annualized, yet for domestic purchases the increase was 1.5%. As is, the price index means there was much more inflation in comparison to last quarter. Since the price index is used to remove inflation from GDP to obtain real growth, more inflation typically means price increases which can eat away at economic growth. We can only guess on what happened at this point with sudden inflation in the price index and one good guess is petroleum prices were higher on imports. Again, we have no idea so far what happened with the price index or why it shot up so much, a good 0.5 percentage points higher than any estimate Below is a graph of the price index..
Nominal GDP: In current dollars, not adjusted for prices, of the U.S. output,was $16,857.6 billion, an 4.8% increase from Q2. In Q2, current dollar GDP increased 3.1%. This goes to show what a difference the price deflator makes in real GDP. All figures are annualized.
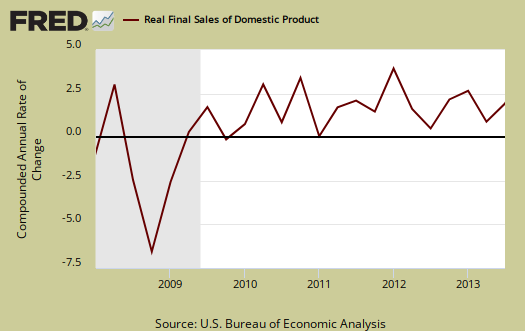
Real final sales of domestic product is GDP - inventories change. This gives a better feel for real demand in the economy. This is because while private inventories represent economic activity, the stuff is sitting on the shelf, it's not demanded or sold. Real final sales increased 2.0% for Q3, which reflects relatively mediocre real demand in the economy Q2 real final sales were 2.1%,. This implies there was no change in real economic demand between quarters.
Gross domestic purchases are what U.S. consumers bought no matter whether it was made in Ohio or China.  ; It's defined as GDP plus imports and minus exports or using our above equation: where P = Real gross domestic purchases. Real gross domestic purchases only increased 2.5% in Q3, the same as Q2. Exports are subtracted off because they are outta here, you can't buy 'em, but imports, as well a know all too well, are available for purchase at your local Walmart. When gross domestic purchases exceed GDP, that's actually bad news, it means America is buying imports instead of goods made domestically. Considering how inventories save the GDP day for Q3, a 2.5% increase in gross domestic purchases for two quarters in a row isn't great news.
Below are the percentage changes of Q3 2013 GDP components, from Q2. There is a difference between percentage change and percentage point change. Point change adds up to the total GDP percentage change and is reported above. The below is the individual quarterly percentage change, against themselves, of each component which makes up overall GDP. Additionally these changes are seasonally adjusted and reported by the BEA in annualized format.
|
Q3 2013 Component Percentage Change (annualized) |
|||
|---|---|---|---|
| Component | Q3 Percentage Change From Q2 2013 | ||
| GDP | +2.8% | ||
| C | +1.5% | ||
| I | +9.5% | ||
| G | +0.2% | ||
| X | +4.5% | ||
| M | +1.9% | ||
The BEA's comparisons in percentage change breakdown of the 3rd quarter GDP components are below. Changes to private inventories is a component of I.
C: Real personal consumption expenditures increased 1.5 percent in the third quarter, compared with an increase of 1.8 percent in the second. Durable goods increased 7.8 percent, compared with an increase of 6.2 percent. Nondurable goods increased 2.7 percent, compared with an increase of 1.6 percent. Services increased 0.1 percent, compared with an increase of 1.2 percent.
I: Real nonresidential fixed investment increased 1.6 percent in the third quarter, compared with an increase of 4.7 percent in the second. Nonresidential structures increased 12.3 percent, compared with an increase of 17.6 percent. Equipment decreased 3.7 percent, in contrast to an increase of 3.3 percent. Intellectual property products increased 2.2 percent, in contrast to a decrease of 1.5 percent. Real residential fixed investment increased 14.6 percent, compared with an increase of 14.2 percent.
X & M: Real exports of goods and services increased 4.5 percent in the third quarter, compared with an increase of 8.0 percent in the second. Real imports of goods and services increased 1.9 percent, compared with an increase of 6.9 percent.
G: Real federal government consumption expenditures and gross investment decreased 1.7 percent in the third quarter, compared with a decrease of 1.6 percent in the second. National defense decreased 0.7 percent, compared with a decrease of 0.6 percent. Nondefense decreased 3.3 percent, compared with a decrease of 3.1 percent. Real state and local government consumption expenditures and gross investment increased 1.5 percent, compared with an increase of 0.4 percent.
Other overviews on gross domestic product can be found here.
Recent comments