
The June 2013 Federal Reserve's Industrial Production & Capacity Utilization report shows a 0.3% increase in industrial production. For Q2 industrial production rose an annualized 0.6%. This is the lowest quarterly industrial production since Q3 2012 and before that, the height of the recession, Q2 2009. The G.17 industrial production statistical release is also known as output for factories and mines. The graph below shows quarterly annualized industrial production.
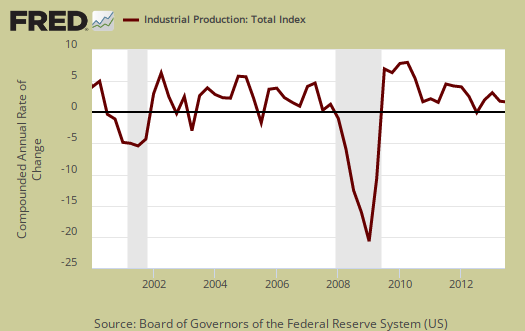
Industrial production does have some correlation to GDP components, but not always. Regardless, the poor quarter is not good news. The below graph is the industrial production index.
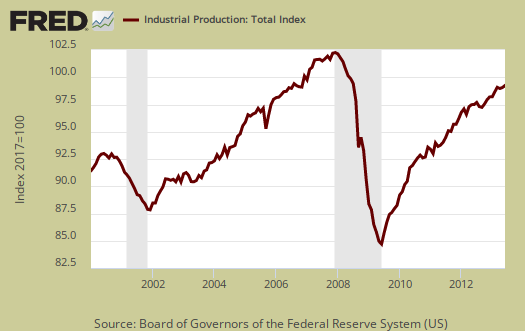
Total industrial production has increased 2.0% from June 2012 and is still down -0.9% from 2007 levels, going on past an incredible six years. Here are the major industry groups industrial production percentage changes from a year ago.
- Manufacturing: +1.8%
- Mining: +4.4%
- Utilities: -0.3%
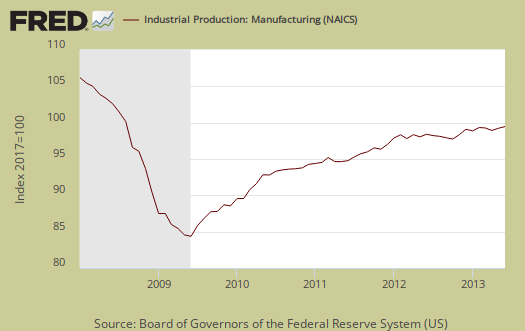
Manufacturing output alone shows a 0.3% monthly change and grew 0.2% annualized for Q2. For Q1 manufacturing grew at a 5.1% annualized rate. Below is a graph of just the manufacturing portion of industrial production.
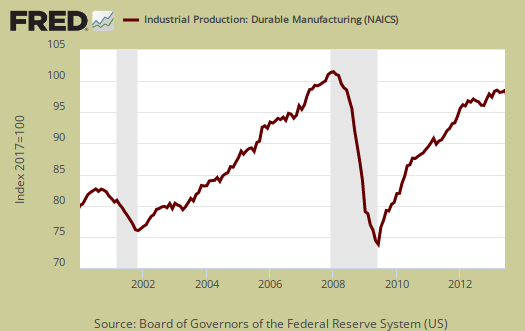
Durable goods increased 0.5% for the month and for Q2 increased at a 1.5% annualized rate. This is more bad news for in Q1 durable goods showed a 6.5% annualized increase.
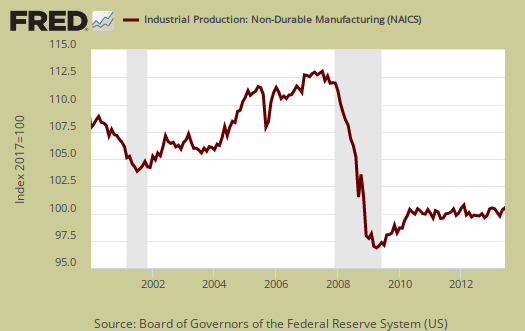
Nondurable goods manufacturing was unchanged for the month. For Q2, nondurables decreased -1.5% annualized. In comparison, Q1 saw a 4.5% annualized growth rate for nondurable goods. Below is a graph of nondurable goods by industry.
There are two reporting methodologies in the industrial production statistical release, market groups and industry groups. Market groups is output bundled together by market categories, such as business equipment or consumer goods. Industrial output is by NAICS codes and is for all manufacturing, or all types of durable goods manufacturing*. Below is the Fed's description of Market groups from the report and their monthly percent changes. Looks like automotive is the bright spot in the otherwise dreary industrial production figures.
The production of consumer goods increased 0.5 percent in June following a decline of 0.3 percent in May. The output of durable consumer goods advanced 1.1 percent in June. Every major component of consumer durables either increased or was unchanged, with automotive products and home electronics posting the largest gains—1.4 percent and 2.2 percent, respectively. After having decreased 0.4 percent in both April and May, the output of nondurable consumer goods rose 0.3 percent in June. The index for non-energy nondurables stepped up 0.5 percent, driven by gains in the indexes for foods and tobacco and for paper products. The output of consumer energy products declined 0.3 percent, marking the third consecutive monthly decrease for this index. The index for total consumer goods moved up at an annual rate of 1.4 percent in the second quarter, a rate of expansion substantially below the increase of 5.6 percent in the first quarter but about the same as in the fourth quarter of 2012. The smaller increase in the second quarter reflected a deceleration in the output of both durables and non-energy nondurables.
The index for business equipment moved up 0.5 percent in June after having fallen 0.1 percent in May and 0.2 percent in April. The gain in June reflected increases of 0.5 percent for transit equipment and 1.1 percent for the industrial and other equipment category. Conversely, the production of information processing equipment dropped 1.0 percent. For the second quarter as a whole, the output of business equipment rose at an annual rate of 2.2 percent, about half of its rate of increase in the previous quarter. The indexes for information processing equipment and for industrial and other equipment recorded substantially slower gains in the second quarter than in the first quarter. By contrast, the index for transit equipment rose at an annual rate of 6.4 percent last quarter to more than reverse a decrease of 2.9 percent in the first quarter.
The output of defense and space equipment increased 0.1 percent in June, the first monthly gain for the index in 2013. The index decreased at an annual rate of about 3 1/2 percent in both the first and second quarters.
Among nonindustrial supplies, the production of construction supplies edged up in June after having edged down in May; output decreased more than 1 percent in both March and April. The index fell at an annual rate of 4.9 percent in the second quarter after having jumped 14.3 percent in the first quarter and 7.2 percent in the fourth quarter of last year. The index for business supplies edged up 0.1 percent in June, its first increase since March; the index decreased at an annual rate of 1.3 percent in the second quarter to reverse about half of its gain in the previous quarter.
The production of materials to be processed further in the industrial sector advanced 0.2 percent in June, the same rate of increase as in May. The output of durable materials gained 0.4 percent in June, led by an increase of 0.8 percent for equipment parts; the index for consumer parts moved down a little, and the index for other durable materials was up slightly. The production of nondurable materials edged down 0.1 percent, as decreases for paper materials and for chemical materials outweighed the rise for textile materials. The output of energy materials stepped up 0.4 percent. For the second quarter as a whole, energy materials advanced at an annual rate of 5.2 percent after having increased 2.2 percent in the first quarter. In contrast, the indexes for both durable and nondurable materials decreased last quarter after having recorded increases in the previous quarter. The output of total industrial materials increased at an annual rate of 0.9 percent in the second quarter, well below the gain of 3.4 percent in the first quarter.
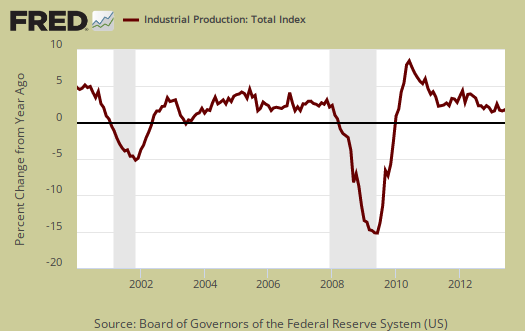
Below is graph of overall industrial production's percent change from a year ago. The Federal Reserve gives long term averages but economic malaise has been going on so long, 2008-2012 are part of those averages now.
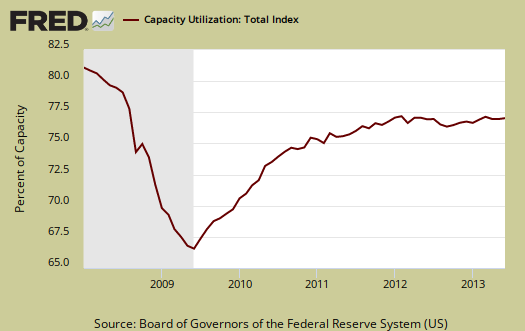
Capacity utilization, or of raw capacity, how much is being used, for total industry is 77.8%, now 2.4 percentage points below the average from 1972 to 2012. Capacity utilization has increased 0.1 percentage points from a year ago and increased 0.1 percentage points for the month. Manufacturing capacity utilization is now 76.1% and is 0.2 percentage points higher than a year ago. Mining capacity utilization is 87.9% and is up 0.2 percentage points from a year ago. Utilities use if it's capacity is 77.6% and this is a decline of -1.2 percentage points from a year ago.
Capacity utilization is how much can we make vs. how much are we currently using, of what capacity is available now, or output rate. Capacity utilization is industrial production divided by raw capacity.
Capacity growth is raw capacity and not to be confused what what is being utilized. Instead, this is the actual growth or potential to produce. Capacity is the overall level of plants, production facilities, and ability to make stuff, that we currently have in the United States. Capacity growth overall has increased 1.8 percentage points from a year ago. Below is the capacity growth increase from a year ago of the subcategories which make up industrial production.
- Manufacturing: +1.5%
- Mining: +4.1%
- Utilities: +1.2%
Capacity growth was revised with this release and it's kind a mixed bag. While the Fed seems to think electronics manufacturing capacity will increase, the trend to go offshore has been most intense in these areas so one must wonder if this is wishful thinking on their part, believing various tech companies press releases versus what they will do in reality.
The estimates for industrial capacity in 2013 were revised for this release. The revisions reflect updated measures of physical capacity from various government and trade sources as well as updated estimates of industry capital spending. Capacity for the industrial sector, measured from the fourth quarter of 2012 to the fourth quarter of 2013, is now expected to increase 1.8 percent, a rate that is 0.1 percentage point slower than previously estimated. Manufacturing capacity is expected to rise 1.6 percent in 2013, a pace 0.2 percentage point less than in previous estimates. Relative to the previous estimates, faster gains in the high-technology and motor vehicles industries have been more than offset by slower gains elsewhere in manufacturing. The increase in mining capacity for 2013 has been revised upward by 0.5 percentage point to 4.4 percent, while the change in capacity for utilities, at 0.9 percent, is 0.2 percentage point faster than previously estimated.
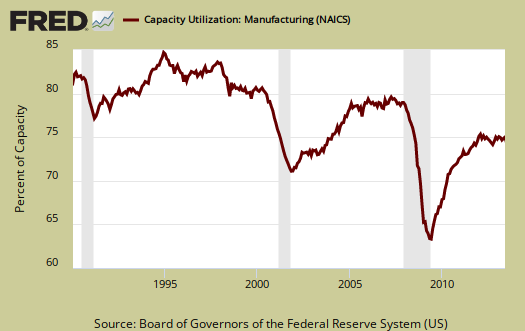
According to the report for 2012, manufacturing uses 77.4% of capacity, with durables about 39.7%. Utilities use 9.9% and mining 12.7% in 2012 (rounded) to give a ratio of manufacturing vs. mining and utilities in terms of capacity. High tech uses 3.7% of total industrial production capacity. Below is the Manufacturing capacity utilization graph, normalized to 2007 raw capacity levels, going back to the 1990's. Too often the focus is on the monthly percent change, so it's important to compare capacity utilization to pre-recession levels and also when the economy was more humming.
Here are our previous overviews, only graphs revised. The Federal Reserve releases detailed tables for more data, metrics not mentioned in this overview. If you are baffled by what crude, finished mean from the G.17 report, read these stages of production definitions. Stages of production have implications for exports and imports. Finishing industrial production implies goods for final sale and thus what kind of output one will see for the month. From the report:
Capacity utilization rates in June for industries grouped by stage of process were as follows: At the crude stage, utilization fell 0.1 percentage point to 86.2 percent, a rate 0.1 percentage point below its long-run average; at the primary and semifinished stages, utilization inched up 0.1 percentage point to 76.0 percent, a rate 5.0 percentage points below its long-run average; and at the finished stage, utilization rose 0.2 percentage point to 76.1 percent, a rate 1.0 percentage point lower than its long-run average.
*From the Federal Reserve definition details:
Market groups consist of products and materials. Total products are the aggregate of final products, such as consumer goods and equipment, and nonindustrial supplies (which are inputs to nonindustrial sectors). Materials are inputs in the manufacture of products. Major industry groups include three-digit NAICS industries and aggregates of these industries-for example, durable and nondurable manufacturing, mining, and utilities./blockquote>
Recent comments