Finally a bit of good news, or it assuredly could have been worse news. The Novemeber Unemployment report from the BLS is out and the rate dropped to 10%, from 10.2% last month.
The unemployment rate edged down to 10.0 percent in November, and nonfarm payroll employment was essentially unchanged (-11,000)
Oops, wait a second, the total number of jobs is unchanged or lowered by -11,000 jobs? Where did the 0.2% of the unemployed go then?
Further in the report we find:
The number of long-term unemployed (those jobless for 27 weeks and over) rose by 293,000 to 5.9 million. The percentage of unemployed persons jobless for 27 weeks or more increased by 2.7 percentage points to 38.3 percent.
So, why did the unemployment rate drop?
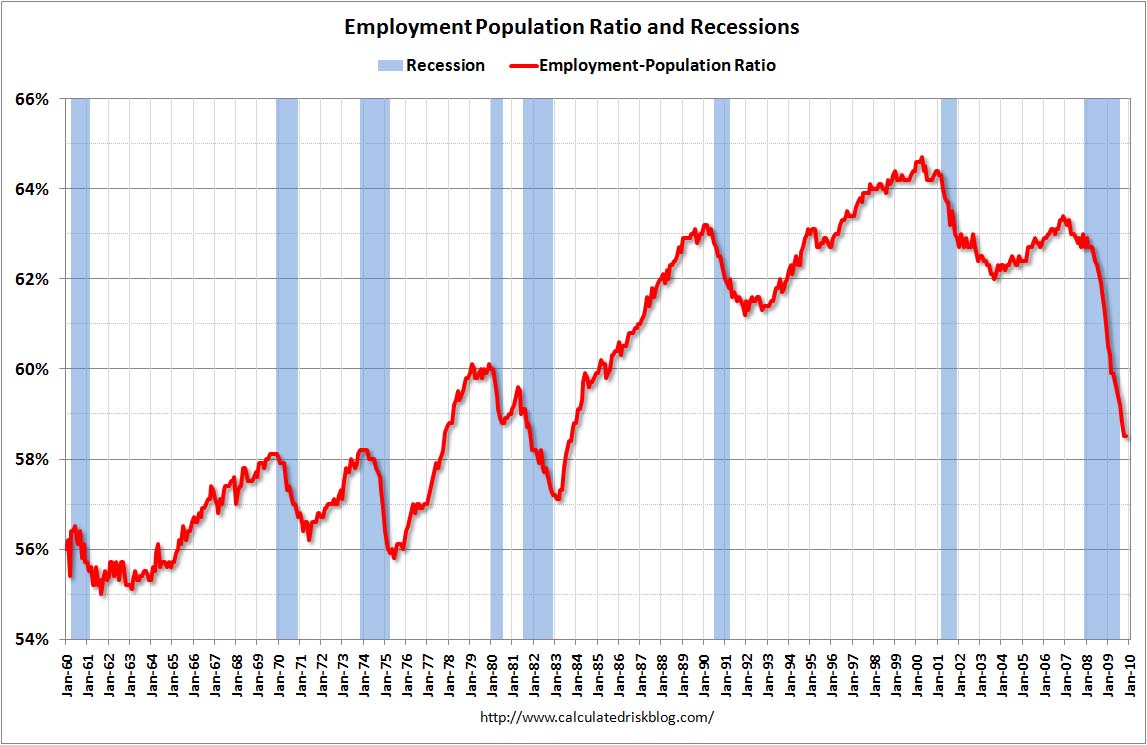
Because the participation rate of the labor force dropped as did the population of the workforce. The U.S. labor force dropped 98,000. Those not in the labor force increased 291,000. It's all ratios, those damn percentages. The total working population is 153,877 + 82,866. Of those participating in the labor market, the ratio is 65%.

Src: Calculated Risk
Then this:
Manufacturing employment fell by 41,000 in November.
and we find this:
Employment in professional and business services rose by 86,000 in November.
Temporary help services accounted for the majority of the increase, adding 52,000 jobs. Since July, temporary help services employment has risen by 117,000.
Supposedly temporary workers are hired initially before employers take the plunge and hire permanent, although cyclical patterns in this recession and age of globalization, I wouldn't completely bank on yet. Officially, as bad as this sounds, by past cycles, this is a good sign they are hiring temporary workers.
Some better news on wages:
In November, average hourly earnings of production and nonsupervisory workers on private nonfarm payrolls edged up by 1 cent, or 0.1 percent, to $18.74.
Over the past 12 months, average hourly earnings have risen by 2.2 percent, while average weekly earnings have risen by 1.6 percent.
U6, the broad measure of those unemployed, edged down to 17.2%. Last month U6 was 17.5%.
So, this report is assuredly some of the most positive news, such that it is, we've had in some time. It doesn't imply any magic "V" recovery, but the numbers were expected to be much worse.

EPI Fact Sheet
Next time someone claims it's all good and soon there will be a chicken in every pot, show them this EPI fact sheet.
We've covered all of these statistics on EP but to see them all laid out in one small sheet makes the blood run from your face.
Big Picture, chart round up
The big picture has all sorts of charts in one post on U.S. unemployment.
here.
Worth checking out so you can see just how bad the unemployment situation really is in comparison to the past.
My fav. is the revisions chart. Many believe this unemployment report is going to be "Revised".