
The U.S. December 2012 monthly trade deficit imploded by -20.7% to $38.54 billion. This is the lowest monthly trade deficit since January 2010 when global trade was still affected by the recession. We estimate Q4 GDP will be revised significantly upward as a result.
December's U.S. exports increased $3.88 billion or 2.1%. Imports declined by -$6.29 billion which is a drop of -3.1% from last November and the largest monthly percentage change since February 2012.

The three month moving average gives a trade deficit of $43,1 billion and a decrease of $0.61 billion. This is a -1.4% decline in the quarterly moving average of the trade deficit., which goes to show the monthly variance isn't necessarily something to be alarmed about. Adjusted for prices, just the three month moving average goods part of the trade deficit by a Census accounting basis, in real dollars, gives a 1.1% annualized increase.
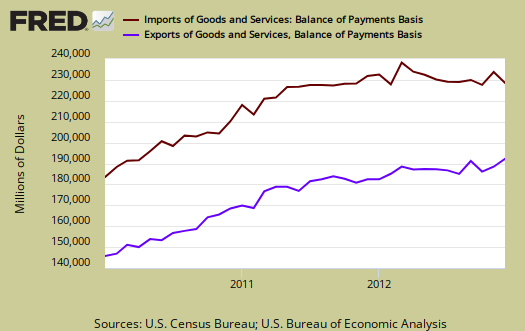
Both of these moving averages imply Q4 GDP trade component will be revised significantly upward. . Real exports quarterly annualized increase for just goods is now +5.9%. Real goods imports quarterly annualized change is now -3.5%. From the advance GDP report, real goods imports quarterly annualized change was reported as –2.7% and real goods exports Q4 annualized change was -7.9%. If other elements of GDP remain the same, which they will not in the Q4 revision including inventories, Q4 GDP will turn positive and reflect growth. Graphed below are imports vs. exports of goods and services. To state the obvious, imports subtract from GDP and exports add and why trade deficits matter.
Below are the goods import monthly changes, seasonally adjusted. Overall imports declined by a whopping -$6.078 billion. December imports dramatic decline is all about oil as crude imports dropped -$3.316 billion. Automotive imports also plunged, but probably due to monthly variance. Additionally even though these figures are seasonally adjusted, the very low consumer goods import increase is unusual.
- Industrial supplies and materials: -$4.241 billion
- Capital goods: -$0.264 billion
- Foods, feeds, and beverages: -$0.075 billion
- Automotive vehicles, parts, and engines: -$0.944 billion
- Consumer goods: +$0.043 billion
- Other goods: -$0.597 billion
Below is the list of good export monthly changes, seasonally adjusted, by end use and on a Census accounting basis, which overall increased by $3.245 billion. Contrary to reports in the press, it was not oil exports that caused the massive increase alone, but non-monetary gold. Non-monetary gold exports increased $1.19 billion, whereas petroleum products, other exports increased by $601 million and then fuel oil by $201 million. That said, the increase in exports is really across the board in goods. Civilian aircraft exports also helped with a monthly increase of $451 million. This offset the drop in automotive and communications equipment, which unfortunately has been even more offshore outsourced recently.
- Automotive vehicles, parts, and engines: -$0.292 billion
- Industrial supplies and materials: +$3.838 billion
- Foods, feeds, and beverages: +$0.096 billion
- Capital goods: -$0.431 billion
- Consumer goods: -$0.240 billion
- Other goods: +$0.275 billion
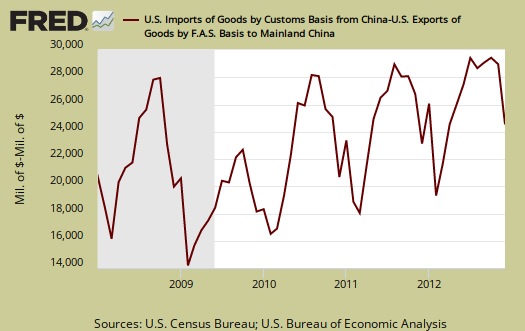
The monthly not seasonally adjusted trade deficit with China was $24.453 billion. The U.S. just hit a new record annual 2012 $315 billion trade deficit with China. The below graph shows the not seasonally adjusted trade deficit with China, which is highly cyclical.
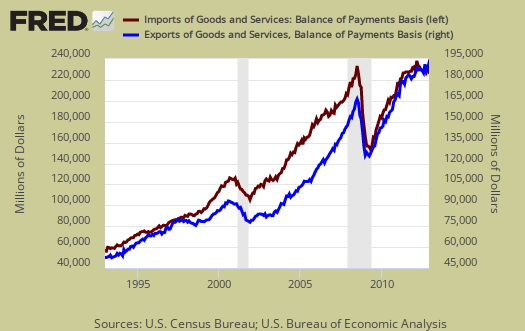
Below is another view of imports (maroon, scale on the left) against exports (blue, scale on the right). Notice the time line. Before NAFTA, 1994 we were breaking even and not running a deficit in trade. The China PNTR came into effect at the end of year 2000 and since then we are getting more trade deals passed with the claim they create jobs when America's export really is jobs. Only a global recession, as happened in 2008, caused the massive trade deficit to shrink.
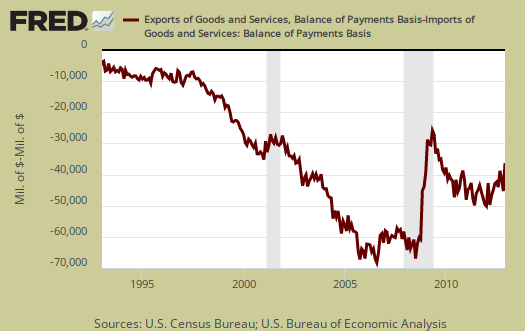
Below is another view of our trade deficit, as it grows with every trade treaty signed. The gray bars in the graph indicate recessions.
Oil or petroleum showed an end use trade deficit actually decreased for the month by $4.68 billion to $18.698 billion. That is a drop of -20.0% in a month. Petroleum related end use was 33.7% of the December goods trade deficit, about a 3% decline from last month and this is not just due to lower prices.
Even though a barrel of oil in December was $95.16, a decline by -2.3% that's not what happened with Petroleum related goods implosion. Using real valued by end use figures, we see petroleum related imports declined by -10.5%, whereas real petroleum related exports increased by 8.5%. It is yet to be seen if this is a colliding trade data reporting time window problem, where the monthly imports and exports happened to match up, or is this change in petroleum related products permanent? Fracking, and poisoning up the water table in the process, fuel production has increased dramatically in the United States.
End use means the final use of the product and includes oil byproducts. For example, plastics are made up of petroleum, yet by their end use category, would be marked often as consumer goods.
The trade deficit in advanced technology decreased for December, which doesn't really mean offshore outsourcing of services has abated as this also is cyclical. The political spin is to claim only low paying, low skilled jobs are offshore outsourced. That clearly is false and amplified by a trade area which has large numbers of advanced R&D and manufacturing jobs. The below report statistics are not seasonally adjusted.
Advanced technology products exports were $27.6 billion in December and imports were $32.9 billion, resulting in a deficit of $5.4 billion. December exports were $1.5 billion more than the $26.0 billion in November, while December imports were $4.9 billion less than the $37.8 billion in November.
Here is the breakdown with major trading partners, not seasonally adjusted with the parenthesis being last month's deficit figures. China is the worst trade deficit, as detailed above. OPEC can be assumed to be oil and the OPEC nations are: Algeria, Angola, Ecuador, Iran, Iraq, Kuwait, Libya, Nigeria, Qatar, Saudi Arabia, United Arab Emirates, Venezuela. The trade deficit with Nigeria is not scams, it's oil, although considering how many financial scams originate from Nigeria, one might think so.
The December figures show surpluses, in billions of dollars, with Hong Kong $4.0 ($3.0 for November), Australia $1.7 ($1.8), Singapore $1.1 ($1.1), and Egypt $0.3 ($0.2).
Deficits were recorded, in billions of dollars, with China $24.5 ($29.0), European Union $8.7 ($12.2), Japan $5.7 ($6.2), Germany $5.4 ($6.2), Mexico $3.9 ($4.9), Canada $3.6 ($2.8), OPEC $3.4 ($6.6), Ireland $1.5 ($2.3), Venezuela $1.3 ($2.0), Korea $1.1 ($1.8), Taiwan $0.9 ($1.3), and Nigeria $0.5 ($1.0).
Here is the BEA website for additional U.S. trade data, such as it is. May we suggest the Census make publicly available much more data so one can compare Apples to Apples, end use, NAICS and seasonally adjusted series. In fact, please complain to your Congressional representatives, for the Census demands $300 dollars per year to access any detail in trade statistics. That's not cool, we already pay for detailed trade statistics with tax dollars.
You might ask what are these Census Basis versus Balance of Payment mentioned all over the place? The above mentions various accounting methods so we're comparing Apples to Apples and not mixing the fruit. The trade report in particular is difficult due to the mixing of these two accounting methods and additionally some data is seasonally adjusted and others are not. One cannot compare values from different accounting methods and have that comparison be valid.
In a nutshell, the Balance of Payments accounting method is where they make a bunch of adjustments to not count imports and exports twice, the military moving stuff around or miss some additions such as freight charges. The Census basis is more plain raw data the U.S. customs people hand over which is just the stuff crosses the border.
The 2005 chain weighted stuff means it was overall modified for a price increase/decrease adjustment in order to remove inflation and deflation time variance stuff.
Bottom line, you want just the raw data of what's coming into the country and going out, it's the Census basis and additionally the details are only reported in that accounting format. Additionally the per country data is not seasonally adjusted so watch out trying to add those numbers into the overall trade deficit. It's a statistical no-no to mix seasonal and non-seasonally adjusted numbers.
Here is last month's trade deficit overview, data unrevised.
Recent comments